Daily and weekly charts indicate the USDINR correction may be coming to an end, potentially signaling the resumption of the longer-term uptrend.
The Federal Reserve's decision to continue the tapering policy has put a lot of downside pressure on emerging market currencies, as traders and investors rush to sell local emerging currencies against the dollar. The Indian Rupee is no exception and, at least fundamentally, indications suggest that the US Dollar will continue to gain strength against its Indian counterpart. Do the long-term fundamentals support this bias, and what will be the key levels if, or if not, it turns out to be correct?
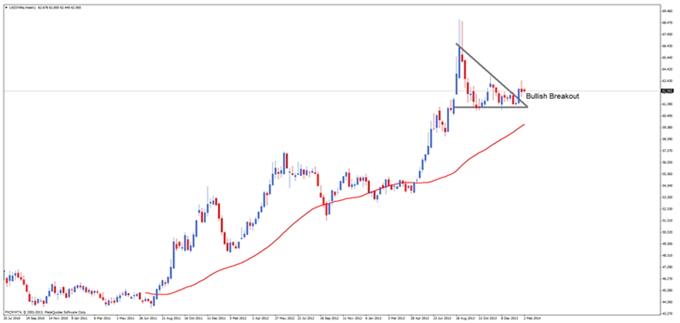
First, take a look at the longer term, weekly chart above. As you can see, a few corrective periods aside, the Dollar has been gaining strength against the Rupee during the past 3-4 years. 2013 was no exception to this rule, with the USDINR rising nearly 30% during the five-month period between April and August. Despite having reached highs just shy of 69.00 flat for two consecutive weeks however, the pair failed to close above 66.33. Since failing to close above this level, something of a descending triangle has formed, coming to a closing point a couple of weeks ago. Traditionally, the descending triangle is a bearish pattern and, in an uptrend, can indicate a pending reversal. This is not always the case however, and often traders will wait for a breakout to confirm the pattern. In this instance, price broke out of the triangle to the upside, invalidating the bearish bias and suggesting the longer-term uptrend might resume. A strong close above the triangle's upper channel, followed by a week of uncertainty, puts a lot of emphasis on this week's price action. As the week develops, there will likely be some clues on the shorter-term charts as to the medium-term future of the USDINR.
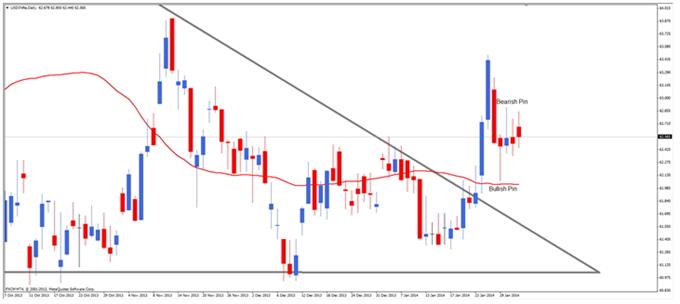
Take a look at the daily chart above. It shows what is effectively a "zoomed in" version of the previous chart, showing the upside breakout in a little more detail. Having closed above the upper triangle line, price rose substantially for two consecutive days, before losing some strength on the third day. Having fallen to a level almost below the initial breakout, price found support at the 50-day moving average. The 50-day moving average is one that both retail and institutional investors watch closely and, as such, can offer strong support or resistance when reached. The bullish pin bar from the 50-day moving average validates the breakout and suggests an uptrend continuation. Having said this, the following day, price formed a bearish pin bar suggesting, temporarily at least, that there is not currently quite enough bullish momentum to fuel a price rise. The next few days echoed this indecision, as price traded within the range of the two pin bars. Key levels to watch will be 62.90, which is the high is the bearish pin bar, and beyond that 63.50, the post-breakout high.
original source


