
Main Points:
• USD/INR began downside movement after worse than expected US data
• Long term bias will remain bullish as far as 61.36 support remains unbroken
• Inflation in India dipped to the lowest level in seven months as RBI increased interest rates last month
USD/INR faced rejection near channel resistance after disappointed US data and India’s inflation report that upbeat expectations. The dollar rupee pair looks ready for more downside movement according to price action analysis.
Retail sales in the US surprisingly fell by 0.4% last month. The January drop in sales followed a revised decline by 0.1% in December, a report by the US commerce department said on Thursday. The median projection of different analysts surveyed by Bloomberg had suggested no change in January sales.
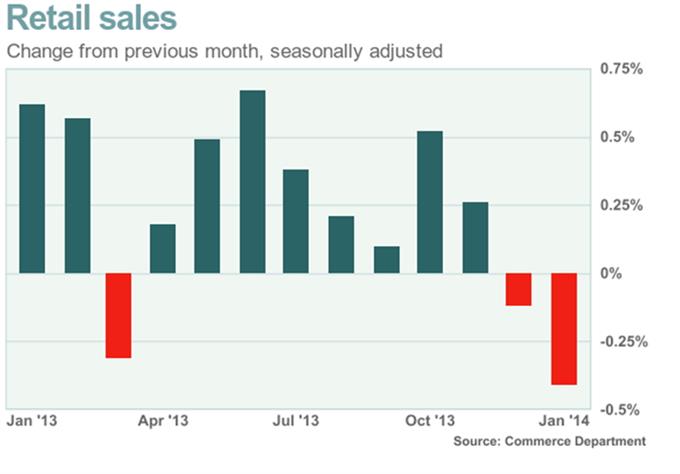
Moreover, the number of people in the US who applied for jobless benefits increased by 8,000 to 339,000 during the week ending on February 9th. Markets were expecting a decrease in jobless claims by 1,000. Overall, Thursday’s reports about the US economy were very negative, which consequently triggered a sharp sell-off in the US Dollar.
The US Dollar Index (DXH4), which gauges the value of greenback against a basket of six major currencies, slid down around 50 pips yesterday and carried on a downside movement during the Asian session on Friday. As of this writing, the US dollar is being traded at 62.17 against the Indian Rupee (INR).
According to price action analysis, the pair is expected to face an immediate hurdle near channel resistance, currently around 62.40. A break and daily close above channel resistance shall accelerate the upward price movement, hence exposing 62.59, the 50% fib level, and then 63.42, the swing high of the previous wave, as can be seen on the following chart.
Indian Rupee - USD/INR Daily Chart
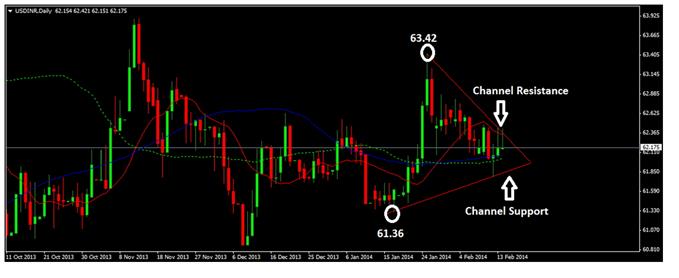
On the downside, USD/INR might find support around 62.00, which is the psychological level, the 100 DMA and the 55 DMA. A break below the 62.00 handle shall expose channel support, currently near 61.80. Below channel support, the final major support can be noted at 61.36; even a slight move below 61.36 will turn our bias into negative.
The Commodity Channel Index (CCI) and the Relative Strength Index (RSI) are almost in neutral territory on the daily chart, meaning long moves might be in play. It is to be noted that inflation in India dipped to the lowest level in more than seven months during January. The inflation index, based on wholesale prices, fell to 5.05% last month according to the government statistics. The Market was expecting 5.60% inflation reading in January, hence the actual outcome beat expectations.
Inflation stood at 7.31% during the same month of previous year and 6.16% in December 2013. In January, the Reserve Bank of India (RBI) had increased overnight lending rate by 0.25% in order to cope with rising inflation.
original source


