Highlights:
- Robust economics: pre-tax net present value (“NPV”) of
C$1.53 billion , post-tax NPV of C$910 million, pre-tax internal rate of return (“IRR”) of 34.4%, post-tax IRR of 24.4% atUS$1,750 per ounce. - At the current gold price of approximately
US$2,000 per ounce, pre-tax NPV5% increases to$2.29 billion and pre-tax IRR increases to 47.8%. - 12.6-year mine life, yielding 24% more gold ounces over 2021 PEA, 77% in the Measured and Indicated category.
- 23% increase in average annual gold production to 255,000 ounces over the life of the mine (“LOM”), with 281,000 ounces average annual production over the first 5 years.
- Average cash cost of
US$841 /oz Au, all-in sustaining (“AISC”) cost ofUS$1,038 /oz Au. - Initial Capital Expenditure of
C$602 million . - Project advancing towards pre-feasibility, focusing on reducing the permitting timeline and resource growth/conversion.
Description of the
The PEA is preliminary in nature and includes Inferred Mineral Resources considered too speculative geologically to have the economic considerations applied to them that would enable them to be categorized as Mineral Reserves, and there is no certainty that the results of the PEA will be realized. Mineral Resources are not Mineral Reserves and do not have demonstrated economic viability.
Since 2016, Probe Gold has been consolidating its land position in the highly prospective Val-d’Or East area in the province of
Ausenco was appointed as lead consultant in August of 2023 to prepare the updated PEA in accordance with NI 43-101 and was assisted by Moose Mountain Technical Services for the mine design.
The independent PEA was prepared through the collaboration of the following firms: Ausenco Engineering Canada ULC (Ausenco), Moose Mountain Technical Services (MMTS), InnovExplo, Knight Piésold Ltd. (KP), Richelieu Hydrogéologie Inc.,
Financial Analysis
The economic analysis was performed assuming a 5% discount rate. On a pre-tax basis, the NPV5% is
Table 1: Summary of Novador Project Economics
| General | LOM Total/Avg | |||
| Gold Price (US$/oz) | ||||
| Exchange Rate (US$:C$) | 0.74 | |||
| 12.6 | ||||
| Total Overburden and Waste Tonnes Mined (kt) | 504,344 | |||
| Total Mill Feed Tonnes (kt) | 80,317 | |||
| Total Underground Mill Feed Tonnes (kt) | 12,418 | |||
| Total Open Pit Mill Feed Tonnes (kt) | 67,899 | |||
| Strip Ratio (tonnes of waste: tonnes of mineralized material) | 7.43 x | |||
| Production | ||||
| 1.30 | ||||
| Mill Recovery Rate (%) | 95.70% | |||
| Total Mill Ounces Recovered (koz) | 3,210 | |||
| Total Average Annual Production (koz) | 255 | |||
| Operating Costs | ||||
| Open | ||||
| Underground | ||||
| Processing Cost (C$/t Milled) | ||||
| G&A Cost (C$/t Milled) | ||||
| Refining & Transport Cost (C$/oz) | ||||
| Total Operating Costs (C$/t Milled) | ||||
| Net Equivalent Royalty after Buyback | 0.80% | |||
| Cash Costs (US$/oz Au) | ||||
| AISC (US$/oz Au) | ||||
| Capital Costs | ||||
| Sustaining Capital (C$M) | ||||
| Closure Costs (C$M) | ||||
| Salvage Costs (C$M) | ( | |||
| Financials | Pre-Tax | After-Tax | ||
| NPV (5%) (C$M) | ||||
| IRR (%) | 34.4% | 24.4% | ||
| Payback (years) | 3.5 | 4.4 |
Notes:
* Cash costs consist of mining costs, processing costs, mine-level G&A, refining and transport charges and royalties
** AISC includes cash costs plus sustaining capital, closure costs, and salvage value
Cautionary Statement - The reader is advised that the updated PEA summarized in this news release is intended to provide only an initial, high-level review of the project potential and design options. The updated PEA mine plan and economic model include numerous assumptions and the use of Inferred Resources. Inferred Resources are considered too speculative geologically to have economic considerations applied to them that would enable them to be categorized as Mineral Reserves, and there is no certainty that the results of the updated PEA will be realized. Mineral Resources are not Mineral Reserves and do not have demonstrated economic viability.
Projected gold production averages 281,000 ounces per year over the first five years and 273,000 ounces per year over the first eight years. The LOM production totals 3,210 koz and averages 255,000 ounces per year. Production will come from open pit mining in the first two years before transitioning to a combined open pit and underground operations afterwards.
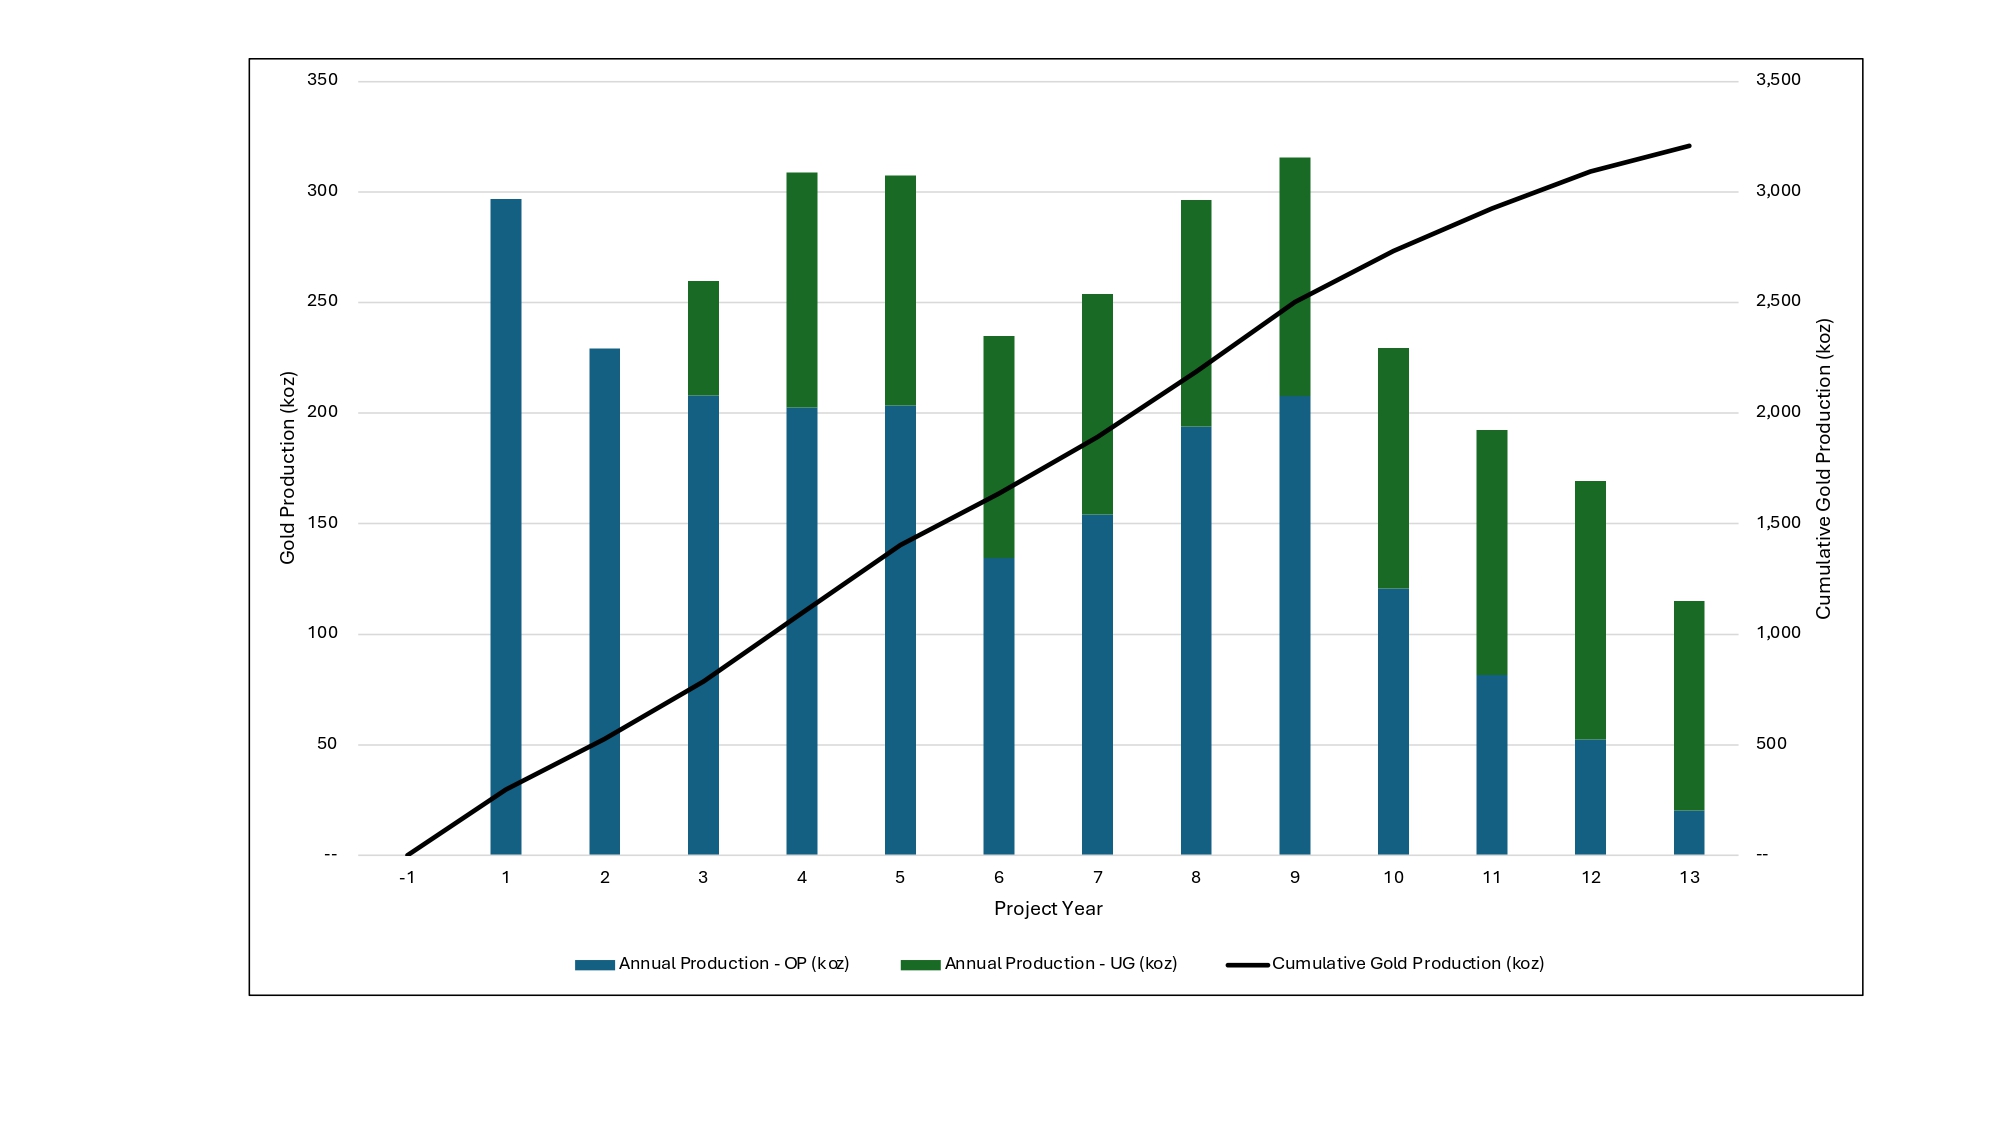
Figure 1: Annual Gold Production
Mine Design and Production Schedule
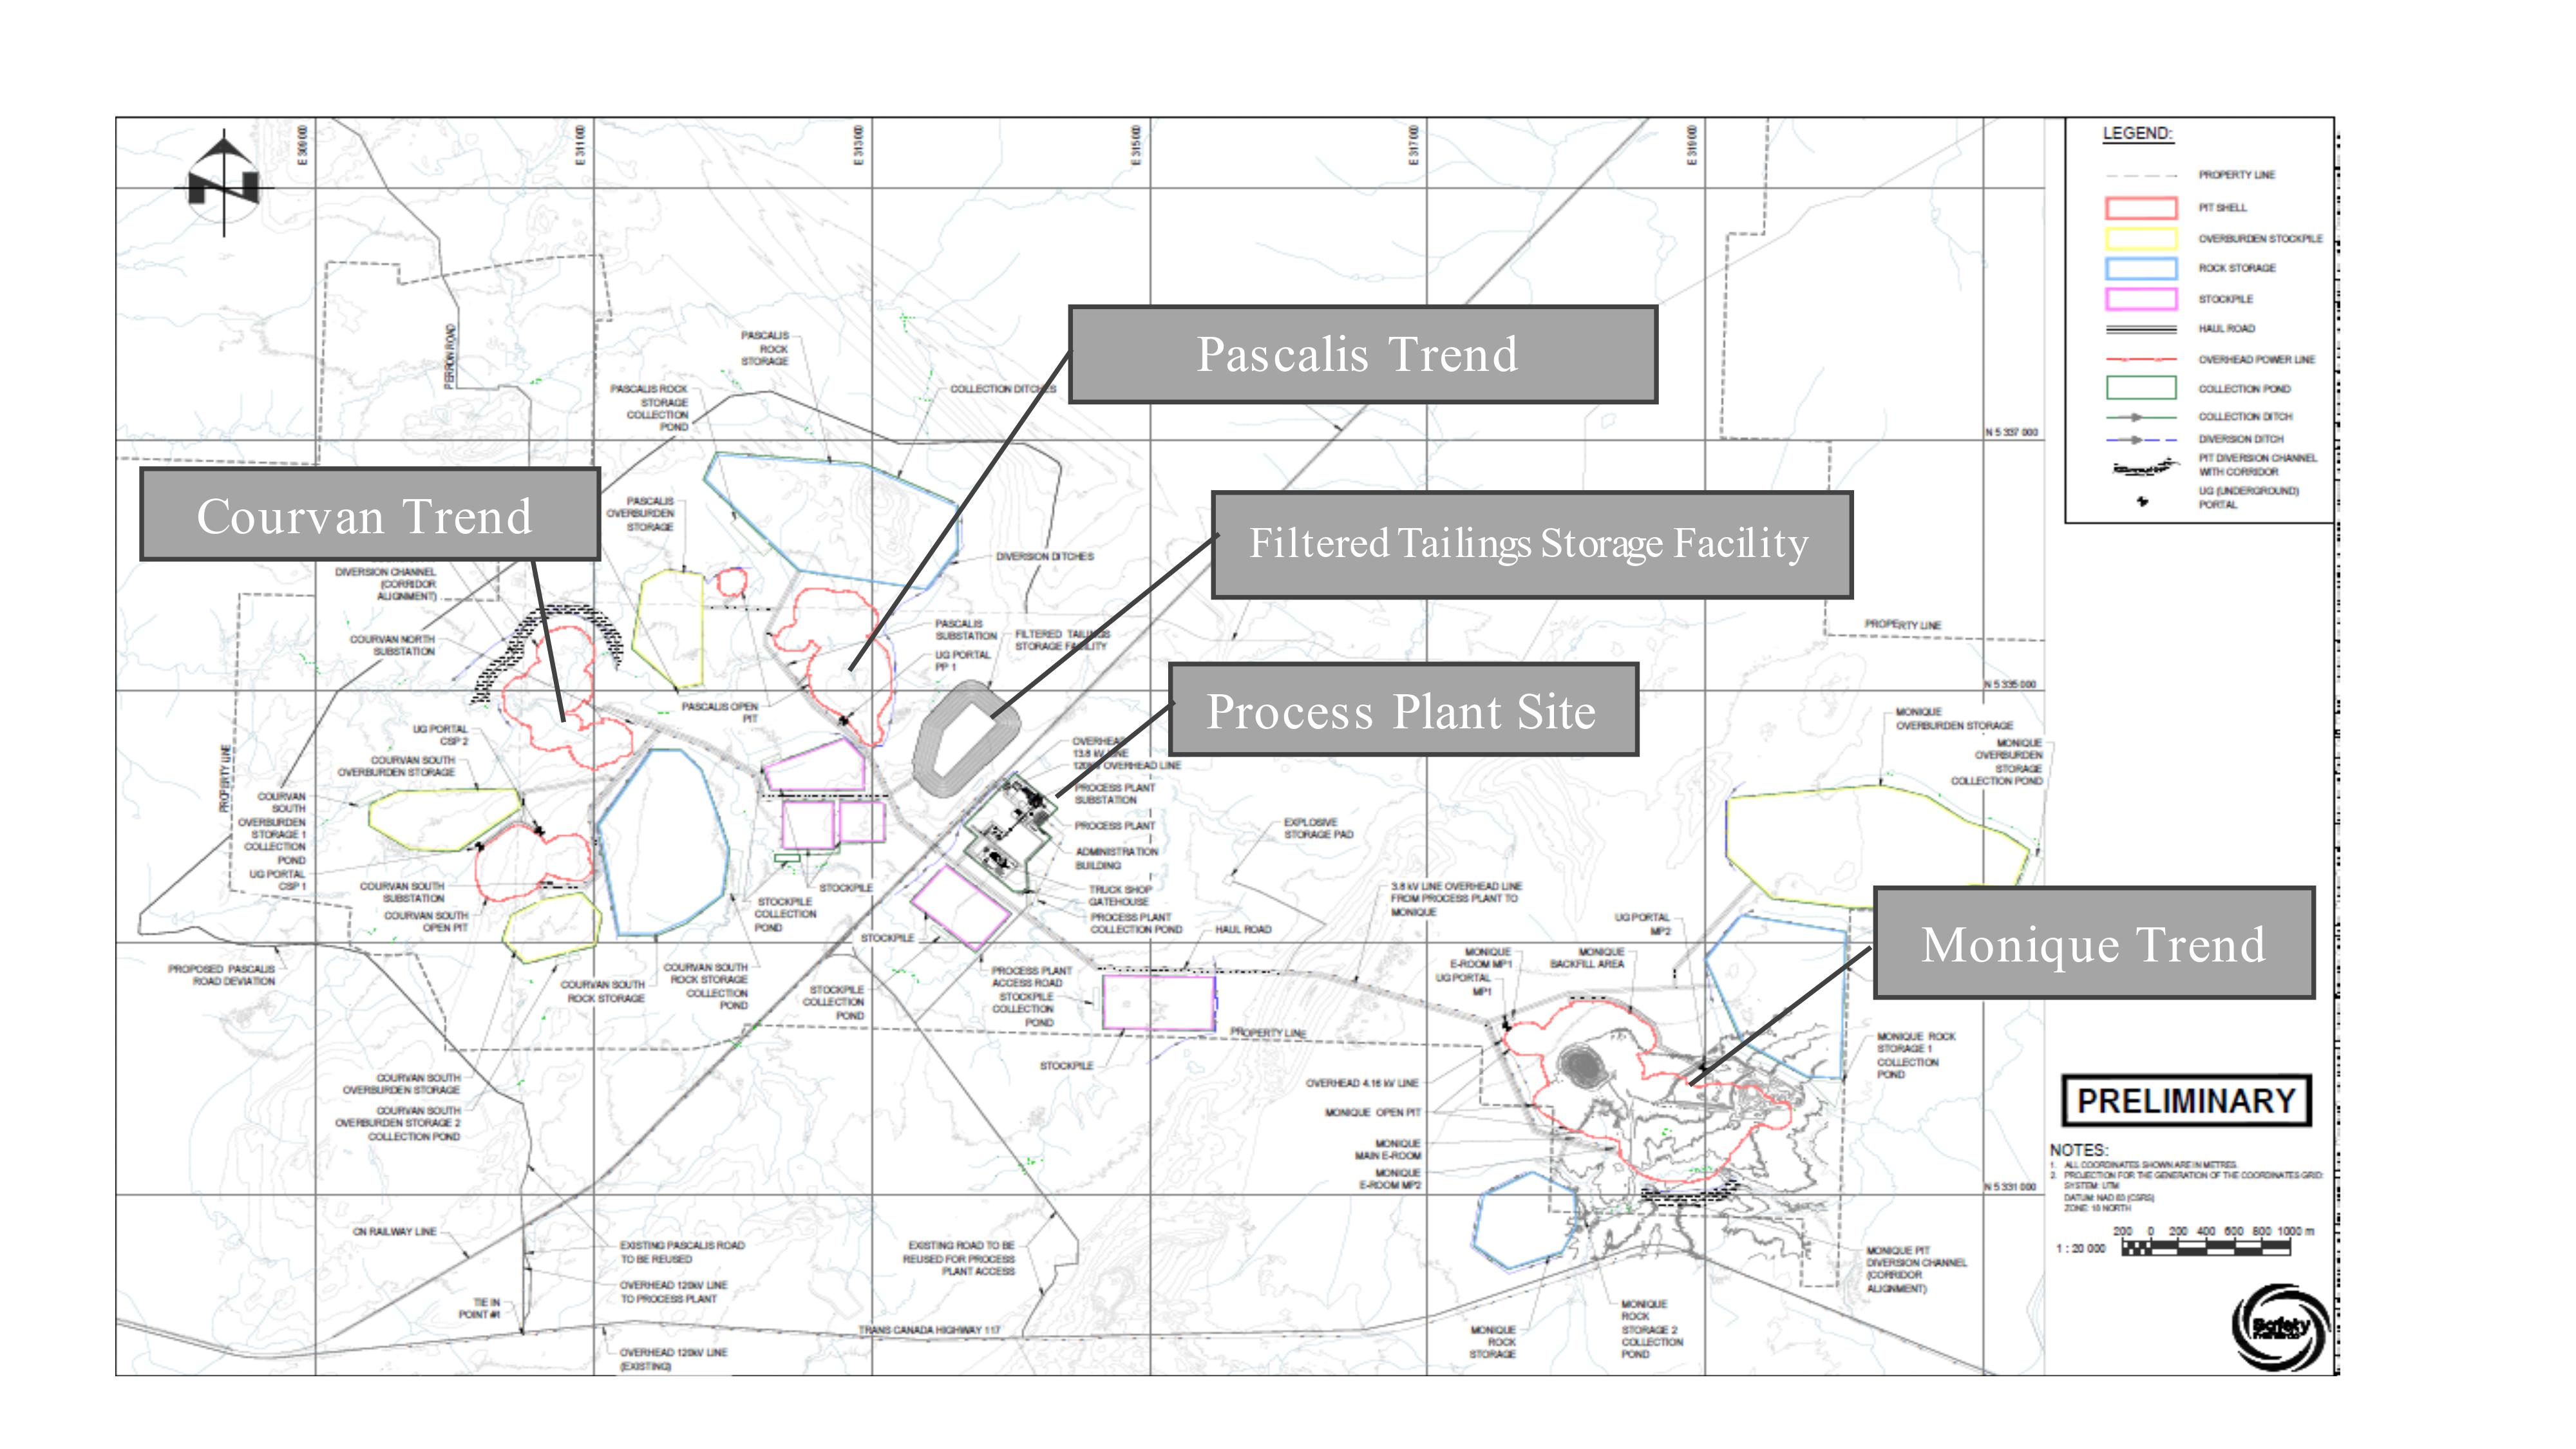
The updated PEA considers open-pit mining from Monique, Courvan, Pascalis gold trends. Underground mining is used to extract material outside of the Monique, Courvan and Pascalis open pits. Underground mining areas are accessed from surface portals and are mined concurrently with the open pits. The underground mining methods considered in this study are longhole retreat for the Monique gold trend and mechanized drift and fill for the Courvan and Pascalis gold trends.
Lerchs-Grossman (LG) pit shell optimizations are used to define the ultimate economic pit limit for each gold trend. Ultimate pit limits are then split into smaller, detailed mining phases which incorporate geotechnical feedback for berm width, bench face angles and overall angles and also include highwall ramps which are appropriately sized for the selected mining equipment. Haulage profiles are built for each destination from each phase, allowing the mining schedule program to include fleet size optimization, along with grade profile and mining rate optimizations.
Underground mining limits consider the expected processing and mining costs, with mining costs dependent upon the selected mining method. These costs are applied to the block model inside a stope optimizer program to develop mining stope areas. The stope areas are examined and small, isolated areas that would incur high development costs are removed. The remaining stopes are applied with appropriate mining loss and dilution factors. Stopes are scheduled with consideration of throughput capacities on the access ramps, ordered sequencing of stopes, timing of underground production relative to open pit production, and overall personnel requirements.
The scheduled mill feed Resources by type are as follows: 5% Measured, 72% Indicated and 23% Inferred.
The owner-operated mining fleet will utilize conventional truck and shovel methods with 16 cubic metre loaders and 135-tonne haul trucks on 12m benches. Non-mineralized material will be placed as near as possible to the pit rims to reduce haulage costs. Mineralized material will be directed to stockpiles or to the mill. Underground material is direct fed to the mill. The average mill feed head grade during the first five years is 1.67 g/t Au and is 1.30 g/t Au over the LOM.
The mining schedule considers one year of pre-production, followed by approximately 12.6 years of mill feed. The mill feed throughput is planned at 15,500 tonnes per day (tpd) for the first 5 years and then 19,200 tpd for the following 7.6 years. The mill feed is comprised of 67.9 million tonnes of open-pit material and 12.4 million tonnes of underground material. The open-pit strip ratio is 7.43 tonnes waste/tonnes mill feed. Over the mine life, total gold production is forecasted to be 2,106koz from open-pit operations and 1,104koz from underground operations.
Metallurgy and Mineral Processing
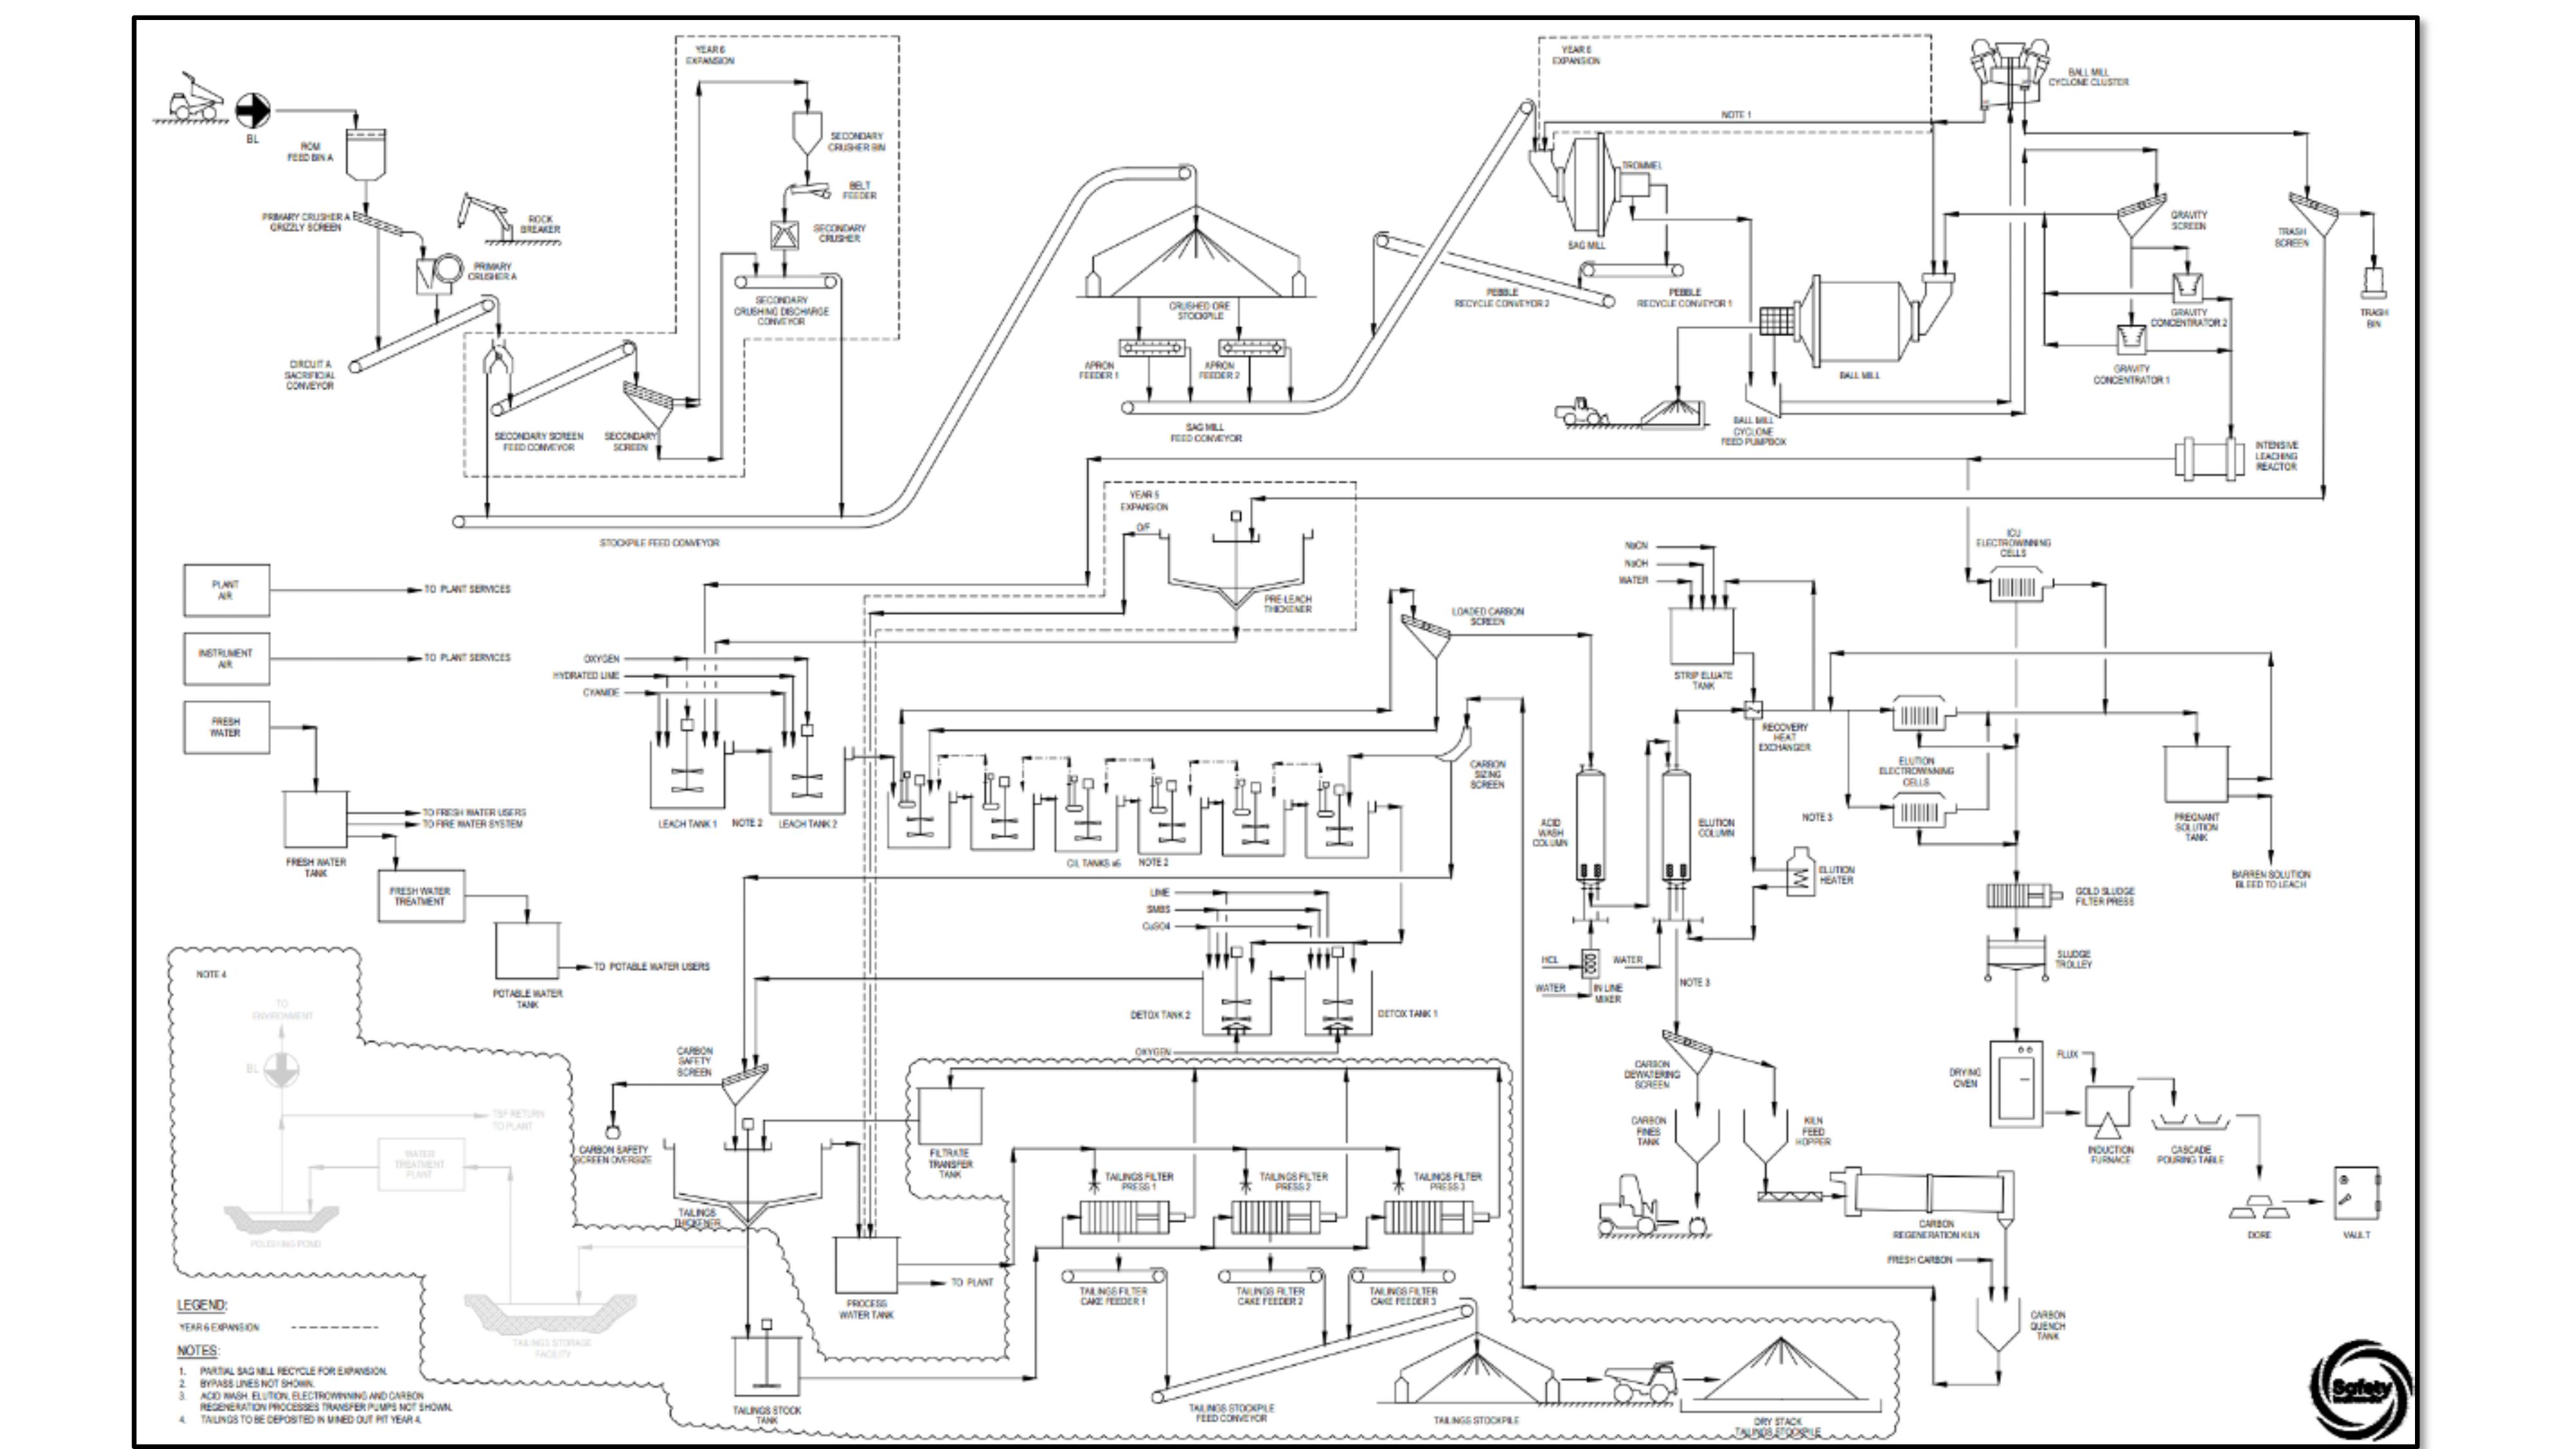
The process plant will employ gravity concentration, standard leaching with carbon-in-leach (CIL) technology for gold recovery. The process plant includes single stage crushing followed by semi-autogenous (SAG) and ball milling, classification, gravity concentration, leach and CIL, and cyanide detoxification before tailings filtration. The filtered tailings will be stored in the filtered tailing storage facility (FTSF) for the first three years. After the New Beliveau/North open pit is depleted in year 3, the tailings will bypass the filtration plant and will be then deposited as a slurry to backfill this open pit. The process plant will treat 5.66 Mt of mineralized material per year at an average throughput of 15,500 tpd until the expansion in year 6.
The process plant will be expanded in year 6 of production to increase the plant capacity to treat 7.00 Mt of material per year at an average throughput of 19,200 tpd. This will be done by adding secondary crushing, pre-leach thickening and increasing the primary grind size from 70 to 83 microns.
The mill design availability is 8,059 hours per year or 92%. The crushing design availability is 5,694 hours per year or 65%. The tailings filtration design availability is 7,183 hours per year or 84%. The process plant has been designed to realize an average recovery of 95.7% of the gold over the life of the
Figure 2: Novador Process Layout
Site Location and Infrastructure
The process plant site location selection considered various factors including social, environmental, topographic, accessibility, proximity to existing infrastructure, and overall flow of material to the FTSF. Centralized administration facilities, truck shop, wash bay, tire store, refueling station, warehousing and explosive magazine are optimized for efficient use of facilities.
Based on ongoing geochemical characterization and the geology of the various deposits, it can be considered that the waste rock, mineralized material and tailings should not be acid-generating nor leachable. These positive characteristics of the
Based on a technology, preliminary siting, ground condition and deposition study for the
Filtered tailings are one of the most sustainable methods for storing tailings as there is no need for a dam to hold them in place or potential long-term storage issues. When dry stacking is applied, the filtered tailings (cake) will be handled using a combination of loaders, trucks and dozers to a stockpile immediately northwest of the filtering plant. The filtered tailings will be loaded into haul trucks for deposition on the FTSF, approximately 2.8 kilometres north of the process plant, by road.
When the deposition method changes to in-pit storage, the slurry will be pumped and transported by pipeline to the depleted New Beliveau/North open pit. This approach is also among the most sustainable methods for storing tailings and has the additional benefit of reducing energy consumption, lower operating cost and the backfilling of an open pit.
Runoff from the FTSF, as well as all storage facilities (rock, mineralized material and over burden stockpiles) will be collected in series of water management ponds and drainage ditches. A public road (,
Figure 3: Novador Project Site Layout
Operating Costs
Operating costs were derived using benchmark information in the Val-d’Or region and are estimated at
Pricing for reagents and consumables was solicited from qualified suppliers and reflects the expected pricing for the project. Reagents and consumables are being delivered by rail.
Table 2: Total Life of Mine Operating Costs
| COST AREA | LOM (C$M) | ANNUAL AVG. COST (C$M) | AVG. LOM (C$/T MINED) | AVG.LOM (C$/T MILLED) | AVG. LOM (C$/OZ) | OPEX (%) | ||||||
| Mine Operating | 74% | |||||||||||
| Mill Processing | N/A | 22% | ||||||||||
| General &Administration | N/A | 4% | ||||||||||
| Total | $3,576 | $284 | N/A | $44.52 | $1,115 | 100% | ||||||
Capital Costs
The total initial capital costs for the
Quotations were solicited from suppliers for the grinding section of the process plant equipment supply cost, which constitutes 36% of the mechanical equipment cost of the project. The remaining mechanical equipment costs were benchmarked from recent Canadian mining studies.
Open pit mining equipment is assumed to be leased (15% down payment with a 10% lease rate over 5 years)
Table 3: Total Capital Costs
| DESCRIPTION | INITIAL CAPITAL COST (C$M) | SUSTAINING CAPITAL COST (C$M) | TOTAL INITIAL AND SUSTAINING CAPITAL COST (C$M) | |||
| MINING | ||||||
| ON SITE INFRASTRUCTURE | ||||||
| PROCESS PLANT | ||||||
| OFF SITE INFRASTRUCTURE | ||||||
| TOTAL DIRECT COSTS | ||||||
| PROJECT INDIRECTS | ||||||
| PROJECT DELIVERY | ||||||
| OWNER'S COSTS1 | - | |||||
| PROVISIONS | ||||||
| TOTAL INDIRECT COSTS | ||||||
| PROJECT TOTAL COSTS | $602.2 | $817.5 | $1,419.7 | |||
1 Includes wetlands and bodies of water compensation.
The
Cashflow Analysis
The projected cash flow and sensitivities are indicated below. The year 6 expansion and the UG development and infrastructure starting in year 2 will be self-funded.
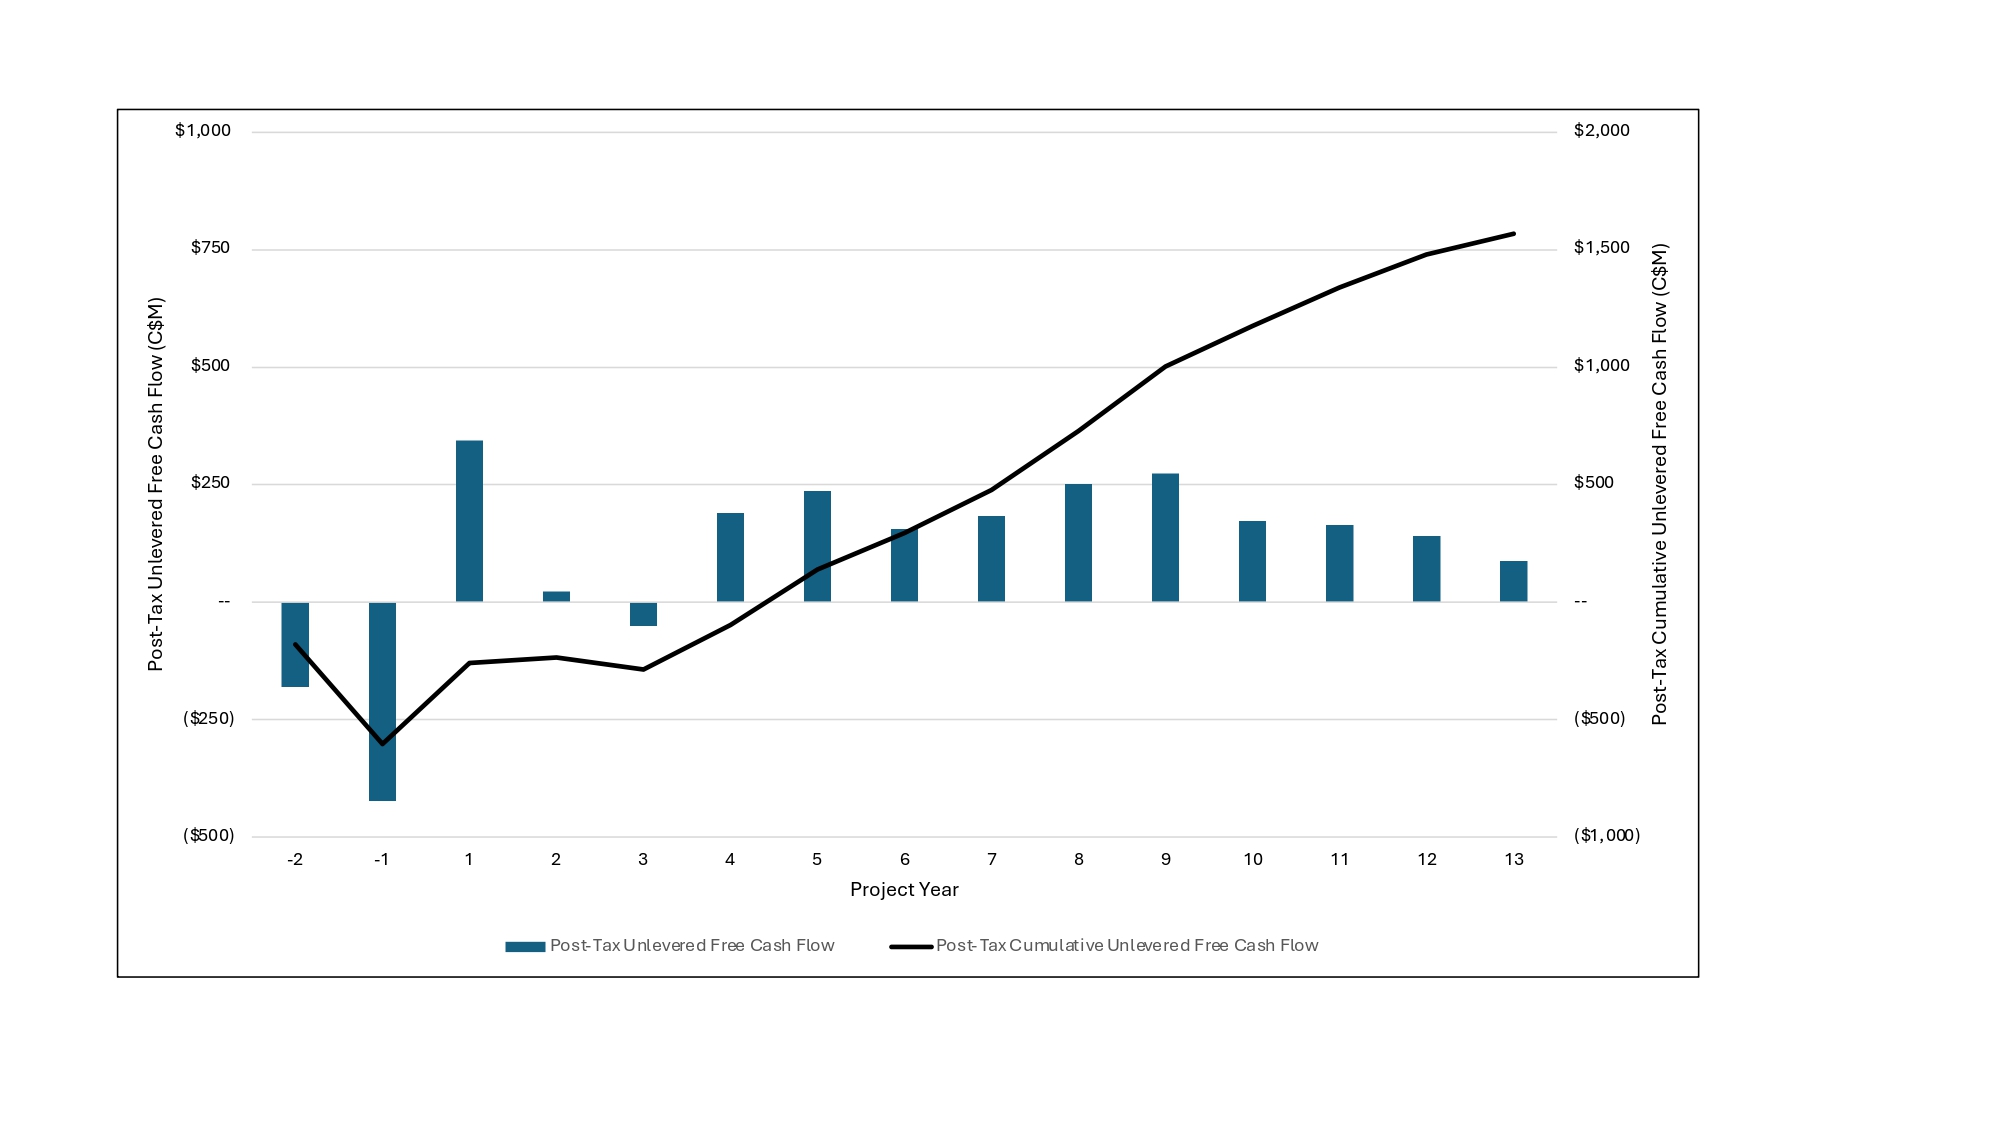
Figure 4: Projected Annual and Cumulative LOM After-Tax Unlevered Free Cash Flow
Sensitivities
A sensitivity analysis was conducted on the base case pre-tax and after-Tax NPV and IRR of the
Table 4: After-Tax Sensitivity Summary
| Gold Price US$/oz | $1,600 | Base Case | $1,900 | $2,050 | $2,200 | ||||||||||
| After-Tax NPV5% | |||||||||||||||
| IRR | 18.5% | 24.4% | 30.1% | 35.4% | 40.5% | ||||||||||
| NPV5%/Capex | 1.0x | 1.5x | 2.0x | 2.4x | 2.9x | ||||||||||
| Payback (Years) | 5.5 | 4.4 | 3.8 | 3.3 | 2.7 | ||||||||||
As shown in Table 5 and Table 6, the sensitivity analysis revealed that the
Table 5: After-Tax NPV5% Sensitivity
| Gold Price US$/oz | After-Tax NPV5% Base Case (C$M) | Total Operating Costs | FX (CAD/USD) | ||||||||||||
| (-20%) | (+20%) | (-20%) | (+20%) | (-20%) | (+20%) | ||||||||||
Table 6: After-Tax IRR Sensitivity
| Gold Price US$/oz | IRR Base Case | Total Operating Costs | FX (CAD/USD) | ||||||||||||
| (-20%) | (+20%) | (-20%) | (+20%) | (-20%) | (+20%) | ||||||||||
| 18.5% | 23.9% | 14.6% | 24.9% | 10.9% | 33.6% | 6.3% | |||||||||
| 24.4% | 31.2% | 19.7% | 30.3% | 17.7% | 40.1% | 12.2% | |||||||||
| 30.1% | 38.1% | 24.6% | 35.5% | 23.9% | 46.2% | 17.8% | |||||||||
| 35.4% | 44.6% | 29.1% | 40.5% | 29.8% | 52.3% | 22.8% | |||||||||
| 40.5% | 50.8% | 33.5% | 45.4% | 35.2% | 58.1% | 27.6% | |||||||||
Opportunities for Project Enhancement
The Novador project still holds substantial exploration potential, which could extend the mine life beyond the 12.6 years outlined in the updated PEA. Probe did not consider any of the resources on the other Val-d’Or East properties. Those could potentially be considered for further exploration and growth.
There is the potential for the underground mine plan to be further optimized to reduce capital cost and improve project economics by deferring development costs later into the mine life.
Ore sorting was part of the 2021 PEA following promising commercial testwork results on the Pascalis trend mineralization. For this PEA, the process flowsheet was simplified by removing the ore sorting plant. There is the potential for re-integrating this technology in the project for some portion of the mill feed to reduce the amount of waste rock and to sell the ore sorting rejects as aggregate material in the construction industry.
The project is currently contemplated as a standalone operation with its own milling facilities. As part of its ongoing process, the Company is evaluating alternative mining and milling scenarios due to the excess milling capacity in the region.
Comparison of 2021 PEA and the Updated PEA
This updated PEA represents the conclusion of 3 years of work since the last PEA in 2021. The following table shows the information used to support the design bases and criteria for the Novador project.
Table 7: Comparing supporting data between 2021 PEA and the Updated PEA
| Information/type of data | 2021 PEA | Updated PEA |
| Block model | Resource based on 380,400m of drilling. Basic geostatistics and technical parameters used for the Mineral Resource Estimate (MRE). | Resource based on 581,000m of drilling. Enhanced geostatistics and tighter technical parameters used for the MRE. |
| Geological model | 3D geological model from exploration and historical drill core supported by structural data. | Enhanced and more constrained 3D geological model from exploration drill core and targeted mine scale drilling including improved structural analysis. |
| Ratio of M&I to Inferred Resources | 44% M&I; 56% Inferred | 77% M&I; 23% Inferred |
| Geotechnical Rock Mass Characterization | Geotechnical assessment from advanced exploration data | Assessment and compilation of initial mine scale geotechnical data from advanced exploration data and targeted mine scale drilling. |
| Open Pit Geomechanical Design Criteria | Conceptual design criteria based on representative geotechnical characterization data, index testing for intact rock strength and limited structural orientation data from exploration drill core | Updated design criteria from detailed geotechnical characterization data, laboratory strength testing for intact rock strength and structural orientation data from targeted mine scale drilling and exploration drill core. |
| Underground Geomechanical Design Criteria | Assumed | Design criteria established from detailed geotechnical characterization data, laboratory strength testing for intact rock strength and structural orientation data from targeted mine scale drilling and exploration drill core. |
| Geotechnical – Overburden Thickness | Based on exploration database and limited historic site investigations at Monique | Based on updated exploration database, and additional site investigations performed in 2022/2023 at Monique, Pascalis, and Courvan for site specific infrastructure (stockpiles and tailings storage facility). |
| Geotechnical – Ground Conditions | Based on limited historic site investigations at Monique | A geotechnical site investigation including a total of 65 test pits and 26 drillholes with 35 monitoring well installations and soil laboratory test work was completed during the period of |
| Stockpiles Design Criteria | Assumed and based on volumetrics and available footprint. | Stockpile designs (including waste rock, overburden and mineralized) are based on slope stability analyses and slope recommendations that consider the proposed dump heights and foundation conditions (including the rate of construction) from recently completed site investigations. |
| Processing and Metallurgy | Design criteria sourced from two preliminary testwork programs: -Sensor based sorting on New Beliveau -Metallurgical testing on drill core composites from the three trends (physical property characterization, mineralogy, gravity amenability, gravity recoverable gold, leach cyanidation and flotation testing) | Design criteria from 2023 testwork program with a total of 57 composites from New Beliveau, Monique, Courvan, Creek and North zone. These were subjected to physical property characterization, mineralogy, gravity amenability, gravity recoverable gold, leach cyanidation and flotation testing. This program included oxygen uptake testing, cyanide detoxification and solids liquid separation testing. |
| Biological Environmental & Constraints | Preliminary biological baseline studies in the Pascalis/Courvan area and historical baseline studies at Monique site. | Detailed biological baseline studies in the three project sites (Courvan, Pascalis and Monique) for vegetation and wetlands, birds, water and fish. |
| Hydrogeology – Physical Environment & Groundwater Inflow | Modeling based on limited testings and a historical study conducted at Monique site in 2011. | Updated modeling to estimate the radius of influence of the activities on groundwater levels based on 2022-2023 site investigation including installation of 35 monitoring wells, hydraulic testing and groundwater sampling within the vicinity of select proposed locations for the project infrastructure. |
| Geochemical Characterization of Waste Rock, Ore and Tailings | Assessment based on more than 250 samples for the Monique, Pascalis and Courvan sites. | Additional 70 samples for the Monique site to confirm the homogeneity of the geochemical composition of waste rock and mineralized units. |
| Metal Leaching and Acid Rock Drainage Prediction | Based on chemical assays and static tests. | Launch of kinetic testing in 2023 using field columns. |
The Novador project has changed significantly since the first PEA in 2021. It has expanded and now boasts a larger production profile. Some of the scope changes include a 55% increase in initial plant capacity, a larger mining fleet with a reduced number of open pits, and a more substantial underground component that begins from the surface rather than the bottom of the open pits. The following table provides a comparison between the 2021 PEA and the current updated PEA (2024).
Table 8: Summary of Novador Project Economics (2021 PEA vs Updated PEA)
| 2021 PEA | Updated PEA | |||||||||||
| General | LOM Total / Avg. | LOM Total / Avg. | ||||||||||
| Gold Price (US$/oz) | ||||||||||||
| Exchange Rate (US$:C$) | 0.75 | 0.74 | ||||||||||
| 12.5 | 12.6 | |||||||||||
| Total Overburden and Waste Tonnes Mined (kt) | 366,924 | 504,344 | ||||||||||
| Total Mill Feed Tonnes (kt) | 38,084 | 80,317 | ||||||||||
| Total Underground Mill Feed Tonnes (kt) | 7,115 | 12,418 | ||||||||||
| Total Open Pit Mill Feed Tonnes (kt) | 45,199 | 67,899 | ||||||||||
| Strip Ratio (tonnes of waste: tonnes of mineralized material) | 6.42 x | 7.43 x | ||||||||||
| Production | ||||||||||||
| 1.88 | 1.30 | |||||||||||
| Mill Recovery Rate (%) | 94.70% | 95.70% | ||||||||||
| Total Mill Ounces Recovered (koz) | 2,584 | 3,210 | ||||||||||
| Total Average Annual Production (koz) | 207 | 255 | ||||||||||
| Operating Costs | ||||||||||||
| Open | ||||||||||||
| Underground | ||||||||||||
| Processing Cost (C$/t Milled) | ||||||||||||
| G&A Cost (C$/t Milled) | ||||||||||||
| Refining & Transport Cost (C$/oz) | ||||||||||||
| Total Operating Costs (C$/t Milled) | ||||||||||||
| Net Equivalent Royalty after Buyback | 0.80% | 0.80% | ||||||||||
| Cash Costs (US$/oz Au) | ||||||||||||
| AISC (US$/oz Au) | ||||||||||||
| Capital Costs | ||||||||||||
| Sustaining Capital (C$M) | ||||||||||||
| Closure Costs (C$M) | ||||||||||||
| Salvage Costs (C$M) | ( | ( | ||||||||||
| Financials | Pre-Tax | After-Tax | Pre-Tax | After-Tax | ||||||||
| NPV (5%) (C$M) | ||||||||||||
| IRR (%) | 47.20% | 32.80% | 34.4% | 24.4% | ||||||||
| Payback (years) | 1.8 | 2.7 | 3.5 | 4.4 | ||||||||
Mineral Resource Estimate
Table 9: Novador Project Mineral Resource Estimate
| All Deposits / Category | Pit-Constrained Resources | Underground Resources | Total | ||||||
| Tonnes | Grade (Au1 g/t) | Gold (oz.) | Tonnes | Grade (Au g/t) | Gold (oz.) | Tonnes | Grade (Au g/t) | Gold (oz.) | |
| Measured | 3,356,300 | 2.34 | 252,100 | 126,400 | 1.87 | 7,600 | 3,482,800 | 2.32 | 259,700 |
| Indicated | 56,297,200 | 1.49 | 2,690,600 | 7,811,000 | 2.38 | 596,700 | 64,108,200 | 1.59 | 3,287,300 |
| M&I | 59,653,600 | 1.53 | 2,942,700 | 7,937,400 | 2.37 | 604,300 | 67,591,000 | 1.63 | 3,547,000 |
| Inferred | 9,915,600 | 1.48 | 472,800 | 6,802,400 | 2.82 | 616,500 | 16,717,900 | 2.03 | 1,089,300 |
1 Au is the symbol for Gold
Notes:
- These mineral resources are not mineral reserves as they do not have demonstrated economic viability. The mineral resource estimate follows current CIM Definitions (2014) and CIM MRMR Best Practice Guidelines (2019).
- The independent and qualified persons (“QPs”) for the mineral resource estimate, as defined by NI 43-101, are
Marina Iund ,P.Geo . (Monique, Courvan SW, Courvan SE,Bussiere Mine ,Bussiere and Creek deposits),Vincent Nadeau-Benoit ,P.Geo . (New Beliveau and North deposits),Martin Perron ,P.Eng . (all deposits) andSimon Boudreau ,P.Eng . (all deposits) ofInnovExplo Inc. The effective date isJuly 13, 2023 . - The presented MRE is taken from the 2023 mineral resource estimate (NI43-101 Technical Report and Updated Resource Estimate for the
Novador Project ,Quebec ,September 1 st, 2023) - The results are presented undiluted and are considered to have reasonable prospects of economic viability.
- The mineral resource estimate is locally pit constrained. The out-pit mineral resource met the standard of reasonable prospects for eventual economic extraction by applying constraining volumes to all blocks (potential underground long-hole extraction scenario) using DSO.
- Monique, Courvan SW, Courvan SE,
Bussiere Mine ,Bussiere , Creek, New Beliveau and North deposits: The pit-constrained mineral resource estimate is reported at a 0.42 g/t Au cut-off grade for the Monique deposit and a 0.40 g/t Au cut-off grade for the other deposits, a value above the base case cut-off grade. A base case cut-off grade of 0.26 g/t Au was calculated using the following parameters: mining cost = CA$2.97/t; mining overburden cost = CA$2.70; processing cost = CA$17.82; selling costs = CA$ 5.00; royalty = CA$ 8.59/oz to CA$ 45.22/oz; gold price =US$ 1,700 /oz; USD:CAD exchange rate = 1.33; bedrock slope angle of 43° to 54°; and mill recovery = 95%. The use of a higher cut-off could allow in-pit mineralized waste (0.20 – 0.40 g/t Au; 0.20 – 0.42 g/t Au) to be selected for potential upgrade through an industrial sorter process. The underground mineral resource estimate is reported at a cut-off grade of 1.43 to 1.71 g/t Au. The underground mineral resources estimate was based on two mining methods depending on the orientation of the mineralization. The cut-off grade was calculated using the following parameters: mining cost = CA$ 81.00 (Long-hole) to CA$ 97.50 (Cut&fill); processing cost = CA$ 17.82; selling costs = CA$ 5.00; royalty = CA$ 8.59/oz to CA$ 45.22/oz; gold price =US$ 1,700 /oz; USD:CAD exchange rate = 1.33; and mill recovery = 95%. - Bordure, Highway and Senore deposits: The pit-constrained mineral resource estimate is reported at a 0.40 g/t Au cut-off grade. The cut-off was calculated using the following parameters: gold price =
US$ 1,600 /oz; USD:CAD exchange rate = 1.33; mining cost = CA$3.00/t or CA$3.50/t; processing + G&A costs = CA$21.50/t; transport cost =$0.15 /t.km; ; bedrock slope angle of 48° to 59°; and mill recovery = 95%. The underground mineral resource estimate is reported at a cut-off grade of 1.65 to 2.05 g/t Au. The underground mineral resources estimate was based on two mining methods depending on the orientation of the mineralization, long-hole retreat at a mining cost of CA$82/t and mechanized cut and fill at a mining cost of CA$110/t and using the same ground unit cost as for the pit-constrained scenario. - The cut-off grades should be re-evaluated considering future prevailing market conditions (metal prices, exchange rates, mining costs etc.).
- The number of metric tonnes was rounded to the nearest thousand, following the recommendations in NI 43-101. Any discrepancies in the totals are due to rounding effects. The metal contents are presented in troy ounces (tonnes x grade / 31.10348).
- The QPs are not aware of any known environmental, permitting, legal, title-related, taxation, socio-political, or marketing issues or any other relevant issue not reported in the Technical Report that could materially affect the Mineral Resource Estimate.
As part of its land consolidation strategy in the Val-d’Or East camp, Probe earned a 60% interest in the Cadillac Break East Property in joint venture with O3 Mining Inc., which includes the Sleepy deposit. The Company also owns a 100%-interest in the Val-d’Or East Lapaska and Croinor properties.
Table 10: Val-d’Or East Other Properties
| Deposit / Category | Pit-Constrained Resources | Underground Resources | Total | ||||||
| Tonnes | Grade (Au g/t) | Gold (oz.) | Tonnes | Grade (Au g/t) | Gold (oz.) | Tonnes | Grade (Au g/t) | Gold (oz.) | |
| Lapaska1 Total Inferred | 512,000 | 1.47 | 24,200 | 460,000 | 3.19 | 47,200 | 972,000 | 2.28 | 71,300 |
| Sleepy2 Total Inferred | -- | -- | -- | 1,113,000 | 4.70 | 167,900 | 1,113,000 | 4.70 | 167,900 |
1 NI 43-101 Technical Report Val-d’Or East Project –
2 NI 43-101 Technical Report Val-d’Or East Project –
3 The Croinor deposit is excluded from Table 10 for the sake of consistency.
Furthermore, by applying industrial sorting to mineralized waste, additional mineral material may be extracted from the mineralized waste and thus become additional mineral resource on the Project.
Table 11:
| All Deposits / Category | Pit-Constrained Mineral Resources | Underground Mineral Resources | Total | ||||||
| Tonnes | Grade (Au1 g/t) | Gold (oz.) | Tonnes | Grade (Au g/t) | Gold (oz.) | Tonnes | Grade (Au g/t) | Gold (oz.) | |
| Measured | 642,100 | 0.29 | 6,000 | -- | -- | -- | 642,100 | 0.29 | 6,000 |
| Indicated | 24,355,000 | 0.31 | 240,800 | -- | -- | -- | 24,355,000 | 0.31 | 240,800 |
| M&I | 24,997,100 | 0.31 | 246,900 | -- | -- | -- | 24,997,100 | 0.31 | 246,900 |
| Inferred | 10,021,200 | 0.28 | 90,100 | -- | -- | -- | 10,021,200 | 0.28 | 90,100 |
1 This additional pit-constrained Mineral Resource represents mineralized waste between cut-off grades of 0.20 g/t Au and 0.42 g/t Au for the Monique deposit and between cut-off grades of 0.20 g/t Au and 0.40 g/t Au for the other deposits, exclusive of pit-constrained Mineral Resource from Table 9. This lower cut-off was based on the following parameters: industrial sorting cost CA$1.73/t, gold recovery in the industrial sorting process at 82% with an overall gold recovery with gravity and leaching at 68%, mass recovery in the industrial sorting process at 42%. Potentially, the industrial sorting results on this material allow obtaining a product above 0.42 g/t Au. For more details on industrial sorting technique and parameters, see the "Val-d’Or East Project, NI 43-101 Technical Report & Preliminary Economic Analysis” (the "Val-d’Or East PEA"), dated
Qualified Person:
Technical information in this release was supervised and approved by
Non-IFRS Financial Measures
The Company has included certain non-IFRS financial measures in this news release, such as initial capital cost, sustaining capital cost, total capital cost, AISC, and capital intensity, which are not measures recognized under IFRS and do not have a standardized meaning prescribed by IFRS. As a result, these measures may not be comparable to similar measures reported by other corporations. Each of these measures used are intended to provide additional information to the user and should not be considered in isolation or as a substitute for measures prepared in accordance with IFRS. Non-IFRS financial measures used in this news release and common to the gold mining industry are defined below.
Total Cash Costs and Total Cash Costs per Ounce
Total cash costs are reflective of the cost of production. Total cash costs reported in the PEA include mining costs, processing and water treatment costs, general and administrative costs of the mine, off-site costs, refining costs, transportation costs and royalties. Total cash costs per ounce is calculated as total cash costs divided by payable gold ounces.
AISC and AISC per Ounce
AISC is reflective of all of the expenditures that are required to produce an ounce of gold from operations. AISC reported in the PEA includes total cash costs, sustaining capital, closure costs and salvage, but excludes corporate general and administrative costs. AISC per ounce is calculated as AISC divided by payable gold ounces.
About Ausenco:
Ausenco is a global company based across 26 offices in 14 countries, with projects in over 80 locations worldwide. Combining deep technical expertise with a 30-year track record, Ausenco delivers innovative, value-add consulting studies, project delivery, asset operations and maintenance solutions to the mining & metals, oil & gas and industrial sectors.
About Probe Gold:
Probe
On behalf of
Dr.
President & Chief Executive Officer
For further information:
Please visit our website at www.probegold.com or contact:
Vice-President of Investor Relations
info@probegold.com
+1.416.777.9467
Forward Looking Statements
Neither TSX nor its Regulation Services Provider (as that term is defined in the policies of the TSX) accepts responsibility for the adequacy or accuracy of this release. This news release includes certain “forward-looking statements” which are not comprised of historical facts. Forward-looking statements include estimates and statements that describe the Company’s future plans, objectives or goals, including words to the effect that the Company or management expects a stated condition or result to occur. Forward-looking statements may be identified by such terms as “believes”, “anticipates”, “expects”, “estimates”, “may”, “could”, “would”, “will”, or “plan”. Since forward-looking statements are based on assumptions and address future events and conditions, by their very nature they involve inherent risks and uncertainties. Although these statements are based on information currently available to the Company, the Company provides no assurance that actual results will meet management’s expectations. Risks, uncertainties, and other factors involved with forward-looking information could cause actual events, results, performance, prospects, and opportunities to differ materially from those expressed or implied by such forward-looking information. Forward looking information in this news release includes, but is not limited to, the Company’s objectives, goals or future plans, statements, exploration results, potential mineralization, the estimation of mineral resources, exploration and mine development plans, timing of the commencement of operations and estimates of market conditions. Factors that could cause actual results to differ materially from such forward-looking information include, but are not limited to failure to identify mineral resources, failure to convert estimated mineral resources to reserves, the inability to complete a feasibility study which recommends a production decision, the preliminary nature of metallurgical test results, delays in obtaining or failures to obtain required governmental, environmental or other project approvals, political risks, inability to fulfill the duty to accommodate First Nations and other indigenous peoples, uncertainties relating to the availability and costs of financing needed in the future, changes in equity markets, inflation, changes in exchange rates, fluctuations in commodity prices, delays in the development of projects, capital and operating costs varying significantly from estimates and the other risks involved in the mineral exploration and development industry, and those risks set out in the Company’s public documents filed on SEDAR+. Although the Company believes that the assumptions and factors used in preparing the forward-looking information in this news release are reasonable, undue reliance should not be placed on such information, which only applies as of the date of this news release, and no assurance can be given that such events will occur in the disclosed time frames or at all. The Company disclaims any intention or obligation to update or revise any forward-looking information, whether as a result of new information, future events or otherwise, other than as required by law.
Photos accompanying this announcement are available at:
https://www.globenewswire.com/NewsRoom/AttachmentNg/61b67a6e-9069-491c-aa80-1d8ce4e9fb27
https://www.globenewswire.com/NewsRoom/AttachmentNg/bf9941c4-4c52-4d8f-b581-3a849d48fce8
https://www.globenewswire.com/NewsRoom/AttachmentNg/927af198-a9c0-45ef-be61-300c7dad94c0
https://www.globenewswire.com/NewsRoom/AttachmentNg/c9aede2e-a1f6-43f7-b34c-5168f974eaf0

![]()
Figure 1
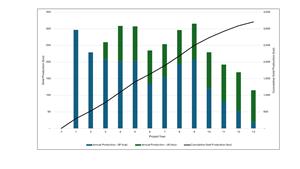
Annual Gold Production
Figure 2: Novador Process Layout
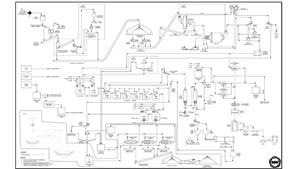
Novador Process Layout
Figure 4: Projected Annual and Cumulative LOM After-Tax Unlevered Free Cash Flow
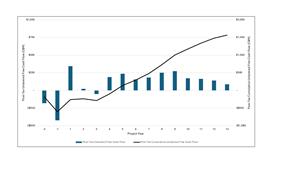
Figure 4: Projected Annual and Cumulative LOM After-Tax Unlevered Free Cash Flow
Figure 3: Novador Project Site Layout
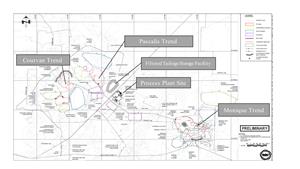
Figure 3: Novador Project Site Layout
2024 GlobeNewswire, Inc., source

