 S&P/ASX 200
 Talking Points:
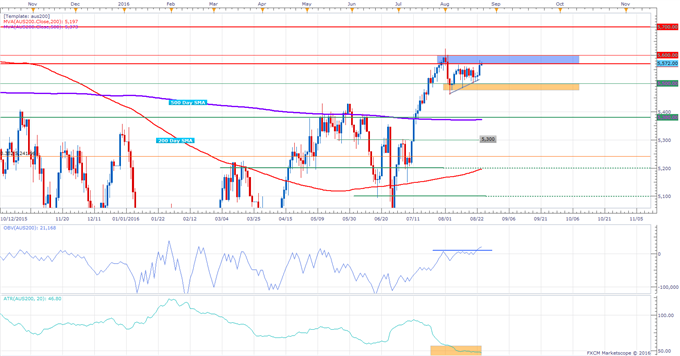
- Index trading at a resistance zone below 5,600 after a push higher
- Price has been trading sideways between 5,500 and 5,570 since the beginning of the month
- 20-day ATR readings still at lowest level since September 2014
Showcase your trading skills against your peers in FXCM's $10,000 Monthly Challenge Here, but learn good trading habits with the “Traits of successful traders” series
The ASX 200 is edging higher at the time of writing, trading at a potential resistance area highlighted in the last reports between 5,570 and 5,600.
Volatility has seen a decline to its lowest levels since September 2014 (based on a 20-day ATR study), perhaps on the backdrop of the “summer lull”.
With that said, a break to either side of this short term sideways trend could induce a pickup in activity as some participants might get caught on the wrong side.
At this stage, focus seems likely to be on the 5,600 level; interestingly, OBV is showing strength relative to price action.
A clear move above 5,600 could indicate the long term uptrend may have resumed and signal further bullish intentions, possibly exposing the 5,700 level initially for potential resistance.
A break below the 5,500 area might shift focus to possible support around the 5,380-5,400 levels.
ASX 200 Daily Chart: August 24 2016
--- Written by Oded Shimoni, Junior Currency Analyst for DailyFX.com
To contact Oded Shimoni, e-mail oshimoni@dailyfx.com
Follow him on Twitter at @OdedShimoni
original source


