Talking Points:
- GBP/USD trading around the 1.29 handle with key event risk on tap
- Inflation figures from UK and the US take center stage in the hours ahead
- US data might push forward Fed rate hike bets on upbeat numbers
The GBP/USD is trading around the 1.29 figure at the time of writing, as the pair continues to edge lower towards its post-Brexit lows below the 1.28 handle.
Looking ahead, UK and US inflation figures headline the economic docket and could prove significant on implications for monetary policy.
Against this backdrop we will form our outlook and look to find short term trading opportunities using different tools such as the Grid Sight Index (GSI) indicator.
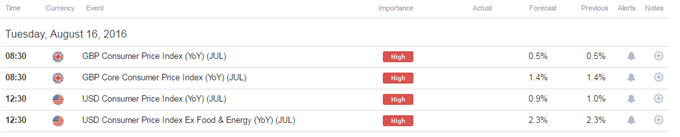
Click Here for the DailyFX Calendar
UK’s July Consumer Price Index (CPI) figures are set to hit the wires 08:30 GMT. Expectations are for the headline year-on-year CPI figure to indicate an annual rise of 0.5%, same as the prior print, while Core CPI is expected to print 1.4%, same as the last report as well.
The figures represent the period immediately after the Brexit vote so it could give indications for the initial inflationary environment post-Brexit.
The BOE announced significant easing measures two weeks ago, so the market might want to see more data as it relates to the banks projections and stimulus effects before going all out on further easing speculation.
Furthermore, higher readings might potentially be shrugged off as the bank focuses on reducing spare capacity at this time, with inflation expected to move higher than previously expected due to the currency depreciation effects. A lower than expected reading might play to a “reduced demand” narrative on Brexit worries, which may send the British Pound lower.
US July CPI data is on tap as well later on. Headline CPI is expected to downtick for a 0.9% print versus the prior 1.0%, while the core figure is forecasted to print 2.3%, same as the prior number.
Inflation is still the “missing piece" for the Fed's dual mandate, so higher than expected readings could have a straightforward effect sending the US Dollar higher. With a probability of 41.9% of a hike in December (according to Fed funds futures at the time of writing), there is still significant scope for the US Dollar to swing to either side on rate path bets, so the CPI data ahead seems likely to be in high focus.
GBP/USD 10-Min GSI Chart: August 16, 2016
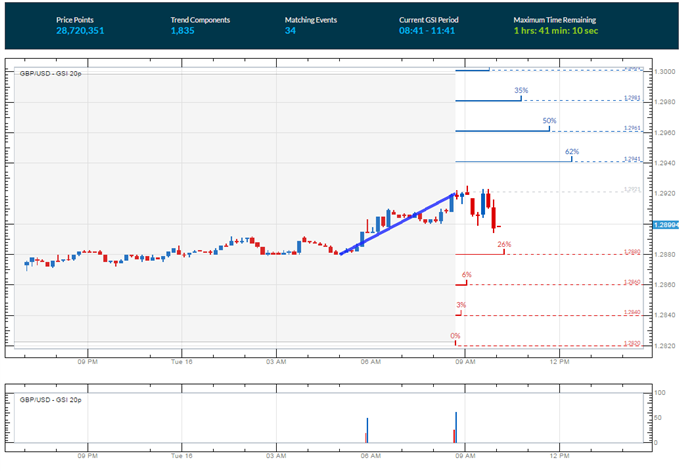
The GBP/USD is pivoting around the 1.29 handle at the time of writing, with GSI calculating significantly higher percentage of past movement to the upside in the short term.
The GSI indicator above calculates the distribution of past event outcomes given certain momentum patterns. By matching events in the past, GSI describes how often the price moved in a certain direction.
You can learn more about the GSI here.
GBP/USD Technical Levels:

Click here for the DailyFX Support & Resistance tool
We use volatility measures as a way to better fit our strategy to market conditions. GBP/USD is still expected to be more volatile versus the US Dollar than most other majors (based on 1-week implied volatility measures), but the market is seeing extremely low levels of volatility with measures such as VIX hitting their lowest levels in two years.
In turn, this may imply that a significant catalyst might be required to break out of more macro levels, so range bound trading plays could be appropriate at the moment, but caution is warranted on the aforementioned event risk.
GBP/USD 30-Min Chart: August 16, 2016
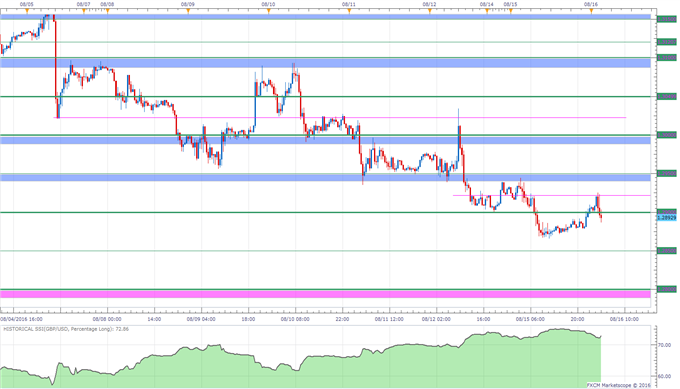
(Click to Enlarge)
The GBP/USD is pivoting around the 1.29 handle at the time of writing.
Other levels of resistance might be interim resistance at 1.2920 followed by a zone below 1.2950, 1.30, 1.3020 and 1.3050.
Levels of support on a move lower might be 1.2850 and an area below 1.28. Lower than that represents levels of three decade lows so focus seems likely to turn to round 50s and 00s.
When price reaches those levels, short term traders might use different technical tools and the GSI to view how prices reacted in the past given a certain momentum pattern.
We generally want to see GSI with the historical patterns significantly shifted in one direction, which alongside a pre-determined bias and other technical tools could provide a solid trading idea that offer a proper way to define risk.
We studied over 43 million real trades and found that traders who successfully define risk were three times more likely to turn a profit.
Read more on the “Traits of Successful Traders” research.
Meanwhile, the DailyFX Speculative Sentiment Index (SSI) is showing that about 72.8% of FXCM’s traders are long the GBP/USD at the time of writing, on the wrong side of the move lower, apparently trying to pick the bottom. The SSI is mainly used as a contrarian indicator implying a short bias.
You can find more info about the DailyFX SSI indicator here
--- Written by Oded Shimoni, Junior Currency Analyst for DailyFX.com
To contact Oded Shimoni, e-mail oshimoni@dailyfx.com
Follow him on Twitter at @OdedShimoni
original source

