Talking Points:
- GBP/USD Rebound Vulnerable to Slowing U.K. Consumer Price Index (CPI).
- USDOLLAR Outlook Remains Mired by Waning Interest-Rate Expectations.
Avoid the pitfalls of trading by steering clear of classic mistakes. Review these principles in the "Traits of Successful Traders" series.
GBP/USD
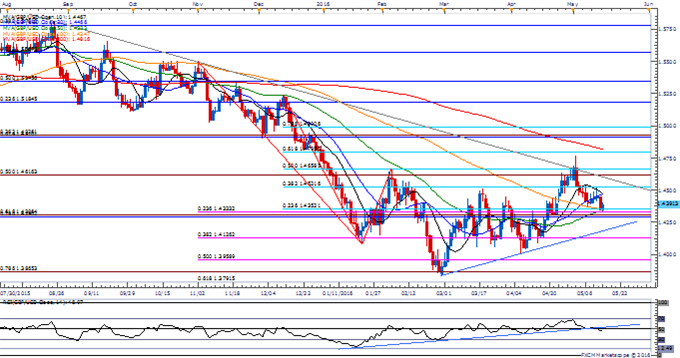
Chart - Created Using FXCM Marketscope 2.0
- GBP/USD may continue to consolidate as the pair remains stuck in a broader wedge/triangle formation, but the exchange rate may continue to come off of the monthly high (1.4769) as the Relative Strength Index (RSI) largely fails to preserve the bullish trend from earlier this year.
- Even though the U.K. Consumer Price Index (CPI) is expected to expand another annualized 0.5% in April, a slowdown in the core rate of inflation may drag on the British Pound as market participants push out bets for a Bank of England (BoE) rate-hike.
- Break/close below 1.4290 (78.6% retracement) to 1.4300 (61.8% expansion) may expose the next downside region of interest around coming in around 1.4130 (38.2% expansion).
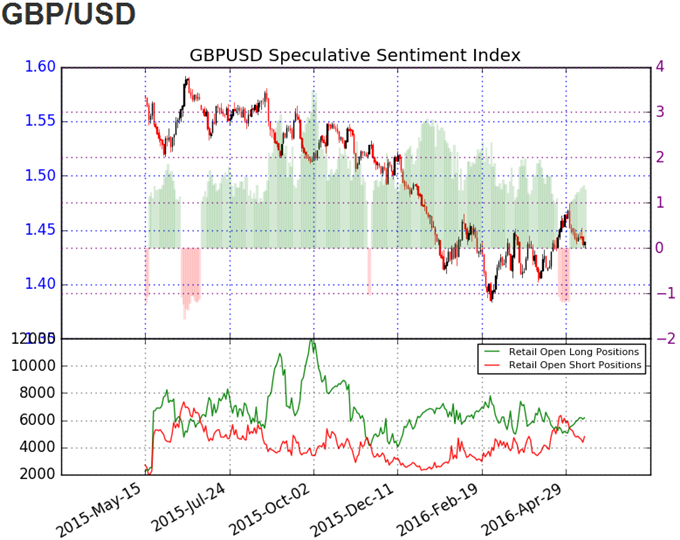
- The DailyFX Speculative Sentiment Index (SSI) shows the retail FX crowd remains net-long GBP/USD since May 12, with the ratio steading working its way towards near-term extremes as it climbed to +2.50 back in March.
- The ratio currently sits at +1.37 as 58% of traders are long, with long positions 9.7% higher from the previous week, while open interest stands 23.5% above the monthly average.
Why and how do we use the SSI in trading? View our video and download the free indicator here
USDOLLAR(Ticker: USDollar):
Index | Last | High | Low | Daily Change (%) | Daily Range (% of ATR) |
DJ-FXCM Dollar Index | 11925.99 | 11942.61 | 11918.36 | -0.09 | 42.48% |
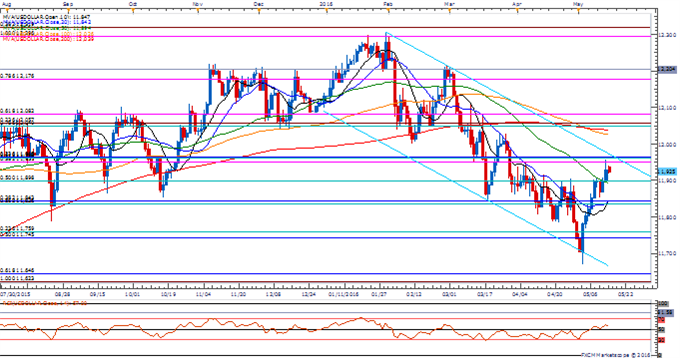
Chart - Created Using FXCM Marketscope 2.0
- May see the bearish trend in the USDOLLAR reassert itself over the coming days amid the lack of momentum to break/close above the Fibonacci overlap around 11,951 (38.2% expansion) to 11,965 (23.6% retracement), while Fed Funds Futures continue to show a less than 10% probability for a Fed rate-hike at the next quarterly policy meeting in June.
- Despite forecasts for a rebound in the U.S. Consumer Price Index (CPI), another slowdown in the core rate of inflation may drag on interest-rate expectations as Chair Janet Yellen remains in no rush to further normalize monetary policy.
- A near-term topping process in the USDOLLAR may open up the downside targets, with the first area of interest coming in around 11,898 (50% retracement) followed by 11,836 (61.8% retracement) to 11,843 (38.2% retracement).
Click Here for the DailyFX Calendar
Get our top trading opportunities of 2016 HERE
Check out FXCM’s Forex Trading Contest
Read More:
USD/CHF Rally? It Just MAY
Gold Bulls Look to CPI, Fed Minutes for Solace
DailyFX Technical Focus: Short Term S&P and Gold Analysis
USD/CAD Technical Analysis: Time For Bulls To Prove Their Worth
--- Written by David Song, Currency Analyst
To contact David, e-mail dsong@dailyfx.com. Follow me on Twitter at @DavidJSong.
To be added to David's e-mail distribution list, please follow this link.
original source
