Talking Points:
- GBP/USD trading around the 1.31 handle in early London trading hours, Carney testimony ahead
- Theresa May is set to take over for David Cameron. Sterling treded higher on the news, but risks loom
- GSI is a powerful big data indicator that can help you determine whether short-term trends will continue or reverse
The GBP/USD is approaching the 1.31 handle (at the time this report was written) after the pair saw a push higher following yesterday’s political developments, in which it became clear that Theresa May is the only conservative nominee left in the running, which paved the way for a “faster than expected” conclusion to the new UK Prime Minister issue. May is expected to take over Cameron Wednesday evening.
Looking ahead, the minutes from the BoE’s FPC meeting and the Carney testimony in the British Parliament are in the spotlight for European trading hours, while Fed-speak is also on the docket later today.
Taking this into consideration, we look to find short term trading opportunities using the Grid Sight Index (GSI) indicator.
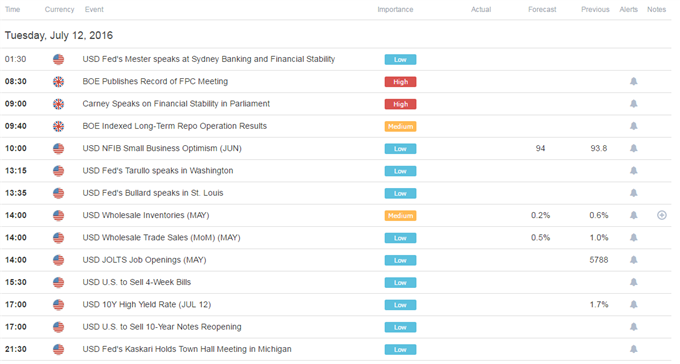
Click Here for the DailyFX Calendar
Minutes the Bank of England's Financial Policy Committee (FPC) meeting are set to hit the wires first. In their latest financial stability meeting the FPC lowered the “countercyclical buffer” from 0.5% to 0.0% in an effort to lower capital requirements from banks following the “Brexit” decision, under the assumption that lower requirements will enable UK’s banks to lend with more ease.
The committee laid out what they see as the risks to the UK’s financial stability and those aspects are set to be discussed in the Carney testimony before the Treasury Select Committee. Market moving impact remains in question, but perhaps further hints by Carney as to future monetary policy ahead of Thursday’s rate decision could prove significant.
An abundance of Fed members speak today as well, with Tarullo, Bullard and Kashkari on the docket. This might provide comments regarding the Fed’s rate path. The market didn’t meaningfully pull forward rate hike bets following Friday’s NFPs, which might imply that rate hikes were being priced out on the backdrop of the global environment, which appears likely to be, at least in part, a result of the “Brexit” vote. Chance of 2016 rate hike have doubled this week compared with the last week and any comments on that front that clashes with the “global concerns” narrative might see US Dollar strength.
GBP/USD 5-Min GSI Chart: July 12, 2016
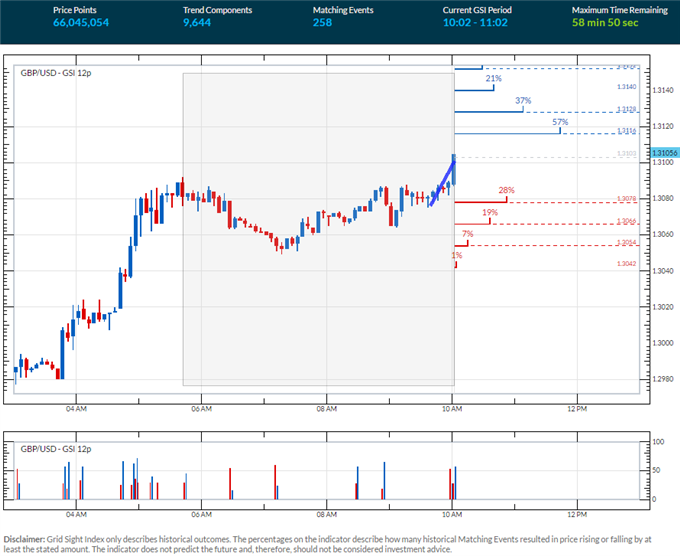
The GBP/USD is attempting a break above the 1.31 handle on London open, and the GSI indicator shows that 57% of similar past momentum events has seen continued upside pressure. The GSI indicator calculates the distribution of past event outcomes given certain momentum patterns, and can give you a look at the market in a way that's never been possible before, analyzing millions of historical prices in real time. By matching events in the past, GSI describes how often the price moved in a certain direction.
You can learn more about the GSI here.
GBP/USD Technical Levels:

Click here for the DailyFX Support & Resistance tool
We use volatility measures as a way to better fit our strategy to market conditions. GBP/USD 1-week implied volatility is the highest of all major pairs on the backdrop of the “Brexit” situation. Combined with the event risk on the docket this may imply that breakout trades are preferable in the short term.
GBP/USD 30-Min Chart: July 12, 2016
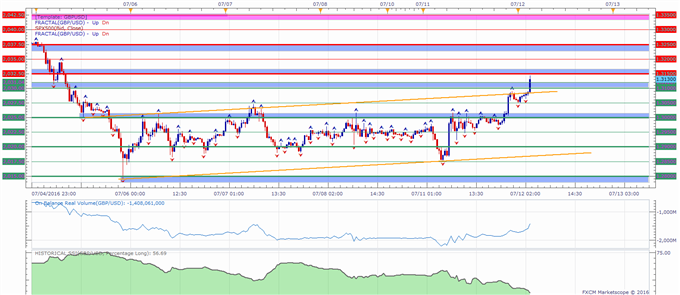
The GBP/USD might find initial resistance in an area above the 1.3150 figure. Further possible resistance levels might be the 1.32 handle, followed by a zone below 1.3250 to 1.3228, the 1.33 level and a zone around the 1.3350 figure which may prove influential.
Levels of potential support on a move lower may be the area above the 1.31 handle followed by 1.3050, an area around 1.30, followed lower to the round 00s and 50s.
When price reaches those levels, short term traders might use the GSI to view how prices reacted in the past given a certain momentum pattern, and see the distribution of historical outcomes in which the price reversed or continued in the same direction. We generally want to see GSI with the historical patterns significantly shifted in one direction, which could potentially be used with a pre-determined bias as well.
A common way to use GSI is to help you fade tops and bottoms, and trade breakouts. That’s why traders may want to use the GSI indicator when price reaches those specific pre-determined levels, and fit a strategy that can offer a proper way to define risk. We studied over 43 million real trades and found that traders who do that were three times more likely to turn a profit. Read more on the “Traits of Successful Traders” research.
Meanwhile, the DailyFX Speculative Sentiment Index (SSI) is showing that about 59.7% of FXCM’s traders are long the GBP/USD at the time of writing. Retail traders flipped net long on the “Brexit” vote, apparently trying to pick a bottom, before seeing the position squeezed lower. Longs have seen quite a substantial reduction following the break below 1.30 to the bottom at around 1.28, which could potentially imply further strength ahead for the pair (see the “Traits of Successful Traders” research).
You can find more info about the DailyFX SSI indicator here
--- Written by Oded Shimoni, Junior Currency Analyst for DailyFX.com
To contact Oded Shimoni, e-mail oshimoni@dailyfx.com
original source

