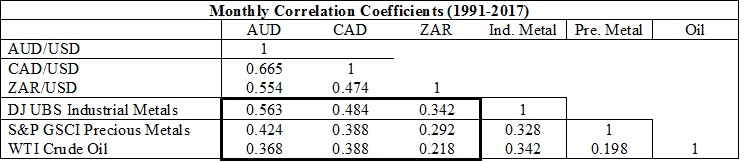
To get a big picture view, we show the monthly correlation coefficient over the past 25 years. The AUD is most sensitive to industrial metal prices, not surprising knowing that iron ore accounts for nearly 25% of Australian exports. CAD is most sensitive to energy prices, again not a shock given the importance of the Canadian oil sands for the Canadian economy. The rand has been the least sensitive to changes in commodity prices, although the correlation coefficients remain significantly positive.
The second factor that contributed to the collapse in our commodity currencies was the perception of a relative solidity of the U.S. economy versus the global economy. We have heard the phrase “the U.S. is the cleanest shirt in a dirty hamper” more than once over the past few years.
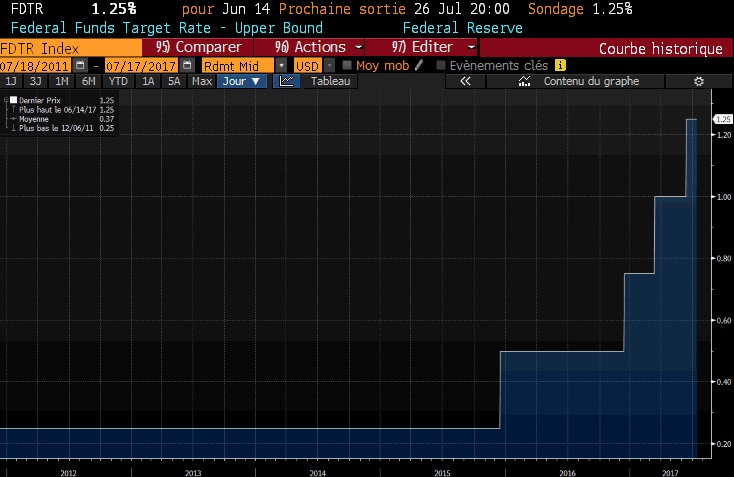
The third reason for the massive underperformance off the commodity currencies has been the relative differences in monetary policy stances of the Federal Reserve versus the Reserve Bank of Australia, the Bank of Canada, and the South African Reserve Bank. The Fed began jawboning monetary policy tightening in 2014 before finally moving rates higher since 2016. The RBA and BoC, notably, have been concomitantly loosening their momentary policies.
Federal Reserve Target Rate:
Reserve Bank of Australia Cash Rate:

Australian Dollar
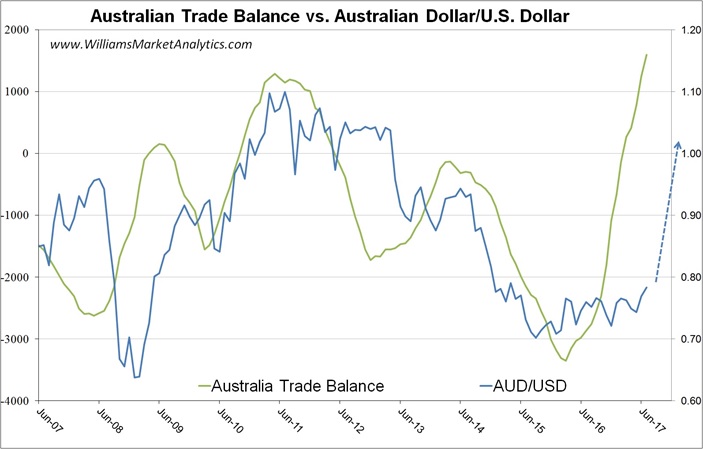
The macroeconomic situation is improving for the AUD. Last week Australian Bureau of Statistics reported a massive surplus of A$2.471 billion (vs A$1.1 billion expected). The Australian trade surplus has skyrocketed, yet the exchange rate has remained relatively subdued. This is surprising, not only because the balance of trade in goods and services is one of the most important macroeconomic indicators influencing the exchange rate, but especially since Australia’s trade balance is heavily influenced by the trade in commodities. Given that Australia’s exports are still relatively cheap (notably iron ore and metals prices), the potential for an expanding trade surplus is great.
The chart below shows the historical relationship between Australia’s trade balance and the AUD/USD rate. If past trends hold, we should witness a sharp appreciation of the AUD in the coming months. Keep an eye on improving Australian dollar fundamentals.
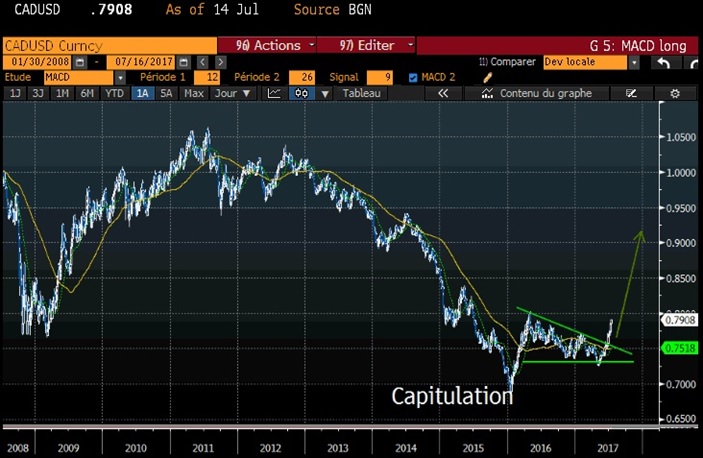
The long-term chart of the AUD is also very appealing. We see a clear multi-year ascending triangle in the AUD/USD. If the A$ gets above $0.79, we should see an acceleration to the upside.
.jpg)
Canadian Dollar
The Bank of Canada (BoC) just raised the benchmark interest rate by 25 basis points to 0.75%, the first hike in seven years (chart below). Senior policymakers have also been repeating hawkish comments. On the macro front, GDP estimates for 2017 and 2018 were upgraded and inflation is being forecasted to return to the 2% target by mid-2018.
The loonie is also set to get support from oil prices, which may see a rebound after the weekly inventories released by the Energy Information Administration (EIA) showed a larger drawdown than expected. At the same time, the EIA is calling for higher global oil demand.
Aside from the macro and commodity variables, a potential obstacle before the end of the year for CAD will be the NAFTA renegotiations slated to begin in late August. We believe that the weight of the presidency has watered down Trump’s campaign rhetoric and that NAFTA renegotiations will be a non-event.
Graphically, the CAD/USD is breaking out to the upside. The CAD experienced selling capitulation in early 2016 with oil prices. We believe that the washout occurred last year and the bottom on CAD is now in.
South African Rand
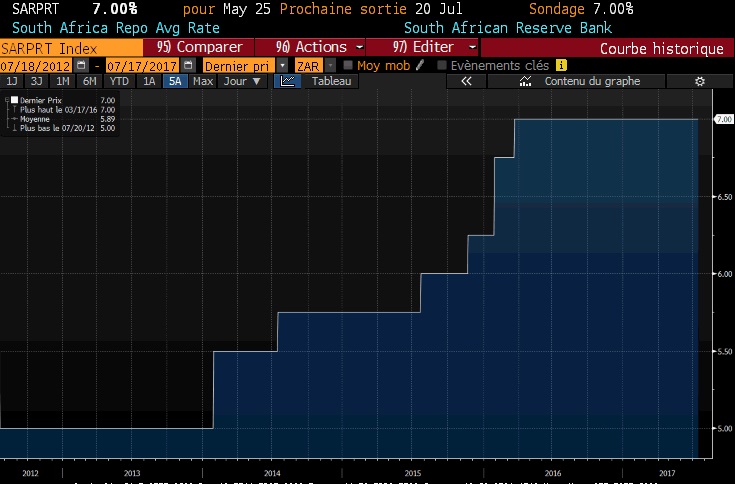
Contrary to the Reserve Bank of Australia and the Bank of Canada, the South African Reserve Bank’s monetary policy is more in line with that of the U.S. Fed. The chart below shows the path of the South African repo rate, which does not explain in weakness in the ZAR/USD since 2011.
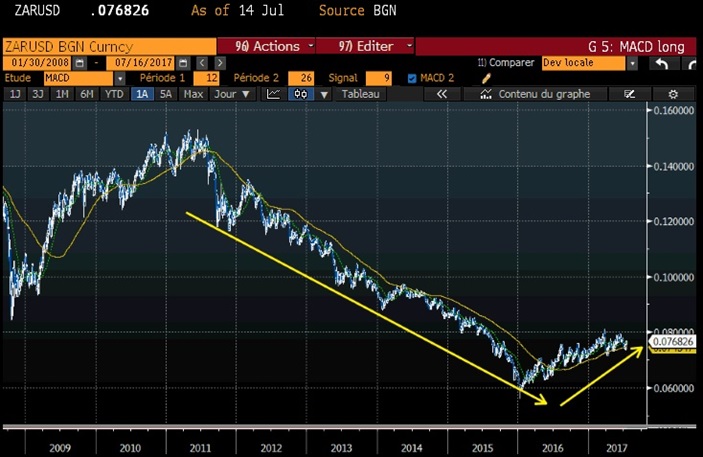
Rather, the South African macroeconomic conditions have not been favourable for the ZAR. Inflation has remained stubbornly high, with the year-to-year change in CPI holding above 5% since 2010…while at the same time the year-to-year change in GDP progressively slowed from a high of 3.5% in 2011 to a low of -0.6% in Q1 2016. The rebound in GDP since Q1 2016 coincides with the bounce in ZAR seen in the chart below. Weakness in metal prices (which we track collectively on the 4-Traders commodities dashboard) also weighed down ZAR since 2011.
The chart of ZAR/USD shows again that capitulation likely occurred in early 2016. With the slope the 200-day moving average turning positive for the first time in five years, we have a high degree of confidence that the bear market in ZAR is finished.
Conclusion
We are bullish on all three commodity currencies. The hawkish Fed rhetoric is not news to any traders while the dovish-to-neutral policy stances of the Australian and Canadian central banks are coming to an end. Our outlook for metals prices is equally bullish and corresponds perfectly to a scenario of rising commodity currencies. Industrial metals will strengthen with global industrial demand, notably from emerging countries like China, while the precious metals prices will receive a bid as investors seek both an inflation hedge and a safe-haven trade as the Federal Reserve unwinds ultra-accommodative monetary policy. We recommend holding onto physical AUD, CAD, and ZAR positions to diversify portfolios with risky stock holdings.


