Talking Points:
- GBP/USD currently trades above 1.4500 after alleged “fat finger” error
- Follow through might prove limited on the back of a quiet economic calendar
- GSI is a powerful big data indicator that can help you determine whether short-term trends will continue or reverse
The GBP/USD currently trades above 1.4500 (at the time this report was written) after a mysterious rally at 04:10 GMT saw the British Pound spike higher versus all other major currencies. The GBP/USD spiked by more than 180 pips, as the newswires cited a possible “fat finger” error, which in turn generated liquidation on automatic stop loss orders. With that said, it is nearly impossible to confirm the accuracy of such theories.
The mysterious move higher comes on the backdrop of the upcoming EU referendum vote, which is set to take place June 23. The British Pound seems to generate significant responses on fluctuations of “Brexit” polls, but no poll was released at the time of the aforementioned move.
A relatively quiet economic calendar today might indicate that technical levels could hold as we look to find short term trading opportunities using the Grid Sight Index (GSI) indicator.
Click Here for the DailyFX Calendar
US Consumer Credit April measure is set to hit the wires in US trading hours and is expected to print 18.00B versus a prior of 29.674B figure. The data is correlated with consumer spending and confidence, but it appears unlikely to generate significant movement for the pair, as other themes such as US dollar weakness on the back of the latest abysmal US Non-farm Payrolls and risk trends might take more prominent role. The British pound was the only major currency not to make gains last week versus the US Dollar, which might imply gains are limited in the context of the upcoming possibility of a “Brexit”.
GBP/USD 5-Min GSI Chart: June 7, 2016
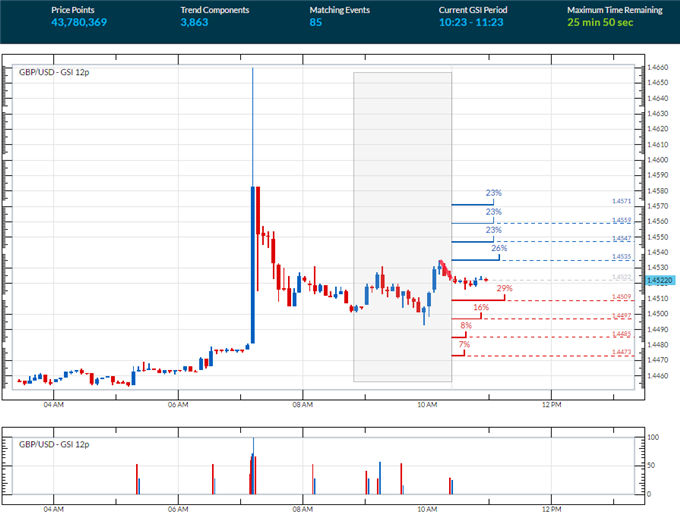
Sideways movement appears to prevail at the moment following the alleged “fat finger” error. The GSI calculates the distribution of past event outcomes given certain momentum patterns, and can give you a look at the market in a way that's never been possible before, analyzing millions of historical prices in real time. By matching events in the past, GSI describes how often the price moved in a certain direction.
You can learn more about the GSI here.
GBP/USD Technical Levels:

Click here for the DailyFX Support & Resistance tool
We use volatility measures as a way to better fit our strategy to market conditions. GBP/USD implied volatility has spiked to levels only comparable to the 2008 great financial crisis. Implied volatility measures the expected volatility, which appears to price in the “Brexit” risk. In actuality the pair does appear to have surges of volatility on “Brexit” polls speculation, which might be taken advantage for breakout type trades, but the quiet economic calendar might mean that technical levels could hold today, which may be used with GSI.
GBP/USD 30-Min Chart: June 7, 2016
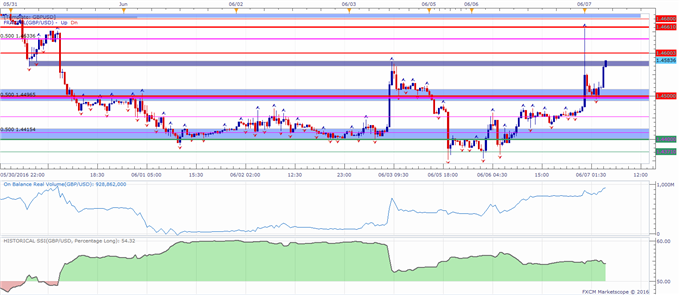
The GBP/USD is trading at resistance around 1.4575. Other levels of interest on a move higher may be 1.4600, followed 1.4634 and 1.4661, with a resistance zone lurking above at 1.4680.
Support might be found around the1.4500 level, followed by 1.4459, and a support zone above 1.4400.
A common way to use GSI is to help you fade tops and bottoms, and trade breakouts. That’s why traders may want to use the GSI indicator when price reaches those specific pre-determined levels, and fit a strategy that might offer a proper way to define risk.
When price reaches those levels, short term traders might use the GSI to view how prices reacted in the past given a certain momentum pattern, and see the distribution of historical outcomes in which the price reversed or continued in the same direction.
Meanwhile, the DailyFX Speculative Sentiment Index (SSI) is showing that about 54.4% of FXCM’s traders are long the GBP/USD at the time of writing.
You can find more info about the DailyFX SSI indicator here
--- Written by Oded Shimoni, Junior Currency Analyst for DailyFX.com
original source
