(via TheNewswire)
 | |||||||||
 |  | ||||||||
Key PEA Highlights
Excellent project economics and financial returns
Robust pre-tax NPV10%of approximately
$764 million and 87.4% IRR on a nominal basis, and a pre-tax NPV10%of approximately$638 million and 82.3% IRR on a real basis.Rapidpaybackof1 yearafterfirstproductionusingaLife of Minespodumeneconcentratepriceof
US$2,800 /t SC5.5 (FOB,Africa ) as forecast byFastmarkets , an internationally recognized price reportingagency.Project Capital Cost Estimate (CAPEX) of
US$147,7M including contingencies,Life-of-Mine (LOM) of 6 years with an estimated annual production of 112,000 t of spodumene concentrate
Low risk plant operation and tailings reclamation
Ready to use tailings dump resources to feed beneficiation plant with minimum cost of mining, crushing, grinding, and processing.
Processplantnameplate capacity is 1.26Mtpa of run-of-mine (ROM) orebasedonrobustflowsheetusinglearningsfromotherlithiumproducers.
Anumberofopportunitieshavebeenidentifiedtoimprovecapital and operatingcostsandplantcapacity. The exploration program is being finalized with a focus on increasing indicated resources and extending life of project.
The PEA was prepared by Sedgman Novopro of
Additionally, we will pursue with our resource definition works to increase the Life of Mine on both the Tailings Property and our highly prospective hard rock lithium Pegmatite Corridor.’’
Executive Summary
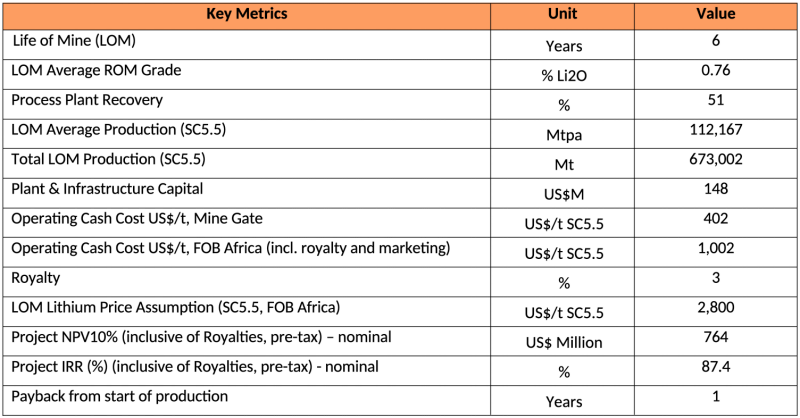
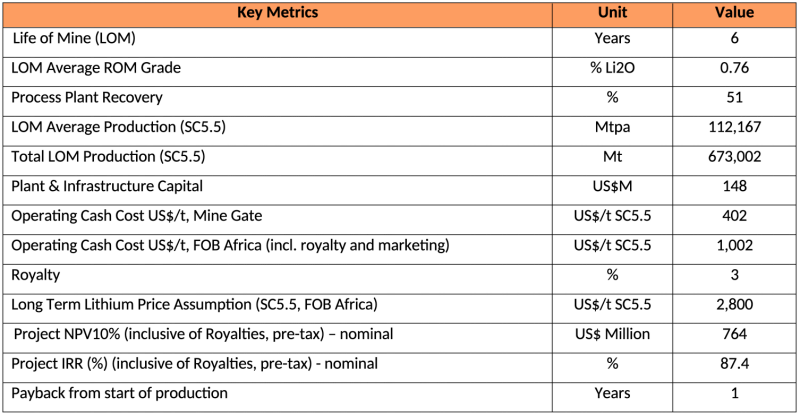
Key metrics are shown below inTable 1for the Manono PEA assume a weighted average lithium concentrate price of
Table 1: Key Financial Metrics
Click Image To View Full Size
The PEA has been completed with the assistance of highly experienced and reputable independent consultants, including:
Mineralresourcemodellingandestimation–MSA Group
Flowsheetdevelopment,engineeringandcostestimation–Sedgman Novopro
The PEA was completed to an overall estimating accuracy of +/-35% (Class 5 estimate) and has a base date of Q4 2023. The Project is based on a 112,167 tpa spodumene mining and processing operation with the Study demonstrating very strong financial metrics. The preliminary economic evaluation indicates the
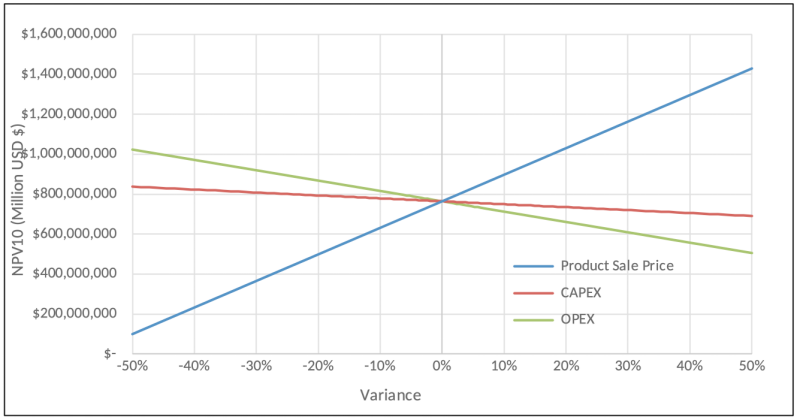
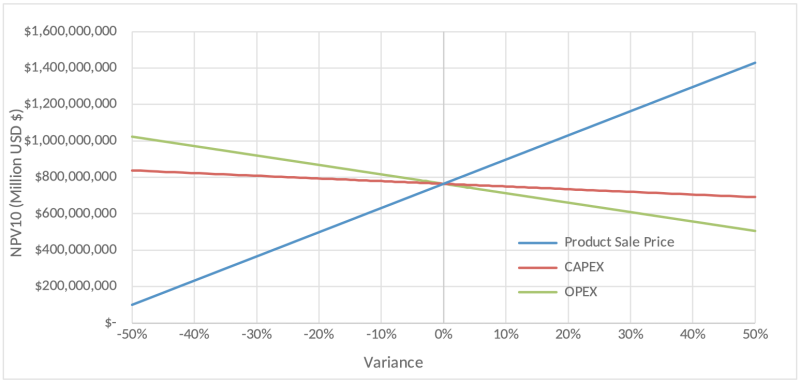
Sensitivity analysis was completed to determine the impact of various factors on the project economics (seeFigure 1). Lithium price has the largest influence on theProject financials. For every 10% increase in the lithium concentrate price, the projectNPV10 increases by
Figure 1: Sensitivity Diagram showing the impact of various sensitivities to the Project economics.
Click Image To View Full Size
Next Steps
The results of the PEA study demonstrate that the
Mineral Resource
A strategy to drill the sloped area of the stacked tailings of the K deposit is currently being investigated, with the aim of providing sufficient data for higher confidence estimates for this material. This would allow to transfer these currently classified inferred resources into the Measured and indicated category.
Recovery Methods
Additional metallurgical testing will be performed during the FS as the bulk samples tested to date are not considered fully representative when compared with the core rejects samples presented in the MRE. New samples for K, G, and I dump, based on the existing drill hole rejects grade and granulometry, have been prepared and sent to laboratory for future metallurgical testing during the FS.
There are several opportunities to optimize the process flowsheet by conducting additional testing of the representative samples. The testing will include as a minimum the following:
Confirm DMS parameters on the representative samples;
Confirm flotation parameters on the representative samples;
Gravity separation for tin and tantalum concentrate recovery;
Gravity separation of slimes (-106µm) to recover spodumene, tin and/or tantalum;
A technology trade-off for mica removal.
Significant opportunities exist to increase the project robustness and financial metrics, notably:
Energy to be taken from the nearby
Piana Mwanga hydroelectric dam currently being refurbishedRecovery of tin and tantalum contained in the tailings.
The Feasibility Study execution is estimated at
Technical Summary-MANONO LITHIUM TAILINGSPEA
Introduction
The Manono Lithium tailings are located within the Tailings Exploitation Permit PER 13698, which is located adjacent to the town of Manono. It consists of 11 tailings dumps spanning a length of 12 km from the southwest towards the northeast. The license is held by Minocom Mining SAS, of which
The PEA has assumed a processing plant capable of treating 1.6 Mtpa of run-of-mine (ROM) ore. SEDGMAN NOVOPRO (SN) were engaged to complete sufficient engineering to generate a capital and operating estimate with an accuracy of +/-35% (Class 5).
Figure 1: Manono Lithium Project Location

Click Image To View Full Size
Mineral Resource
Geology
The Manono Lithium tailings are technogenic deposits, created from the processing of material from the Manono‑Kitolo deposit, which was mined from 1919 to the mid-1980’s for tin and columbite-tantalite (coltan). Nine out of the eleven tailings were drilled, of which five form this Mineral Resource Estimate. The tailings deposits stretch over a length of 12 km, in a northeast-southwest direction, immediately adjacent to the mined pits. Several of the deposits consist of a mixture of material types, typically pegmatite and laterite, with some clay material being present in minor quantities in specific deposits.
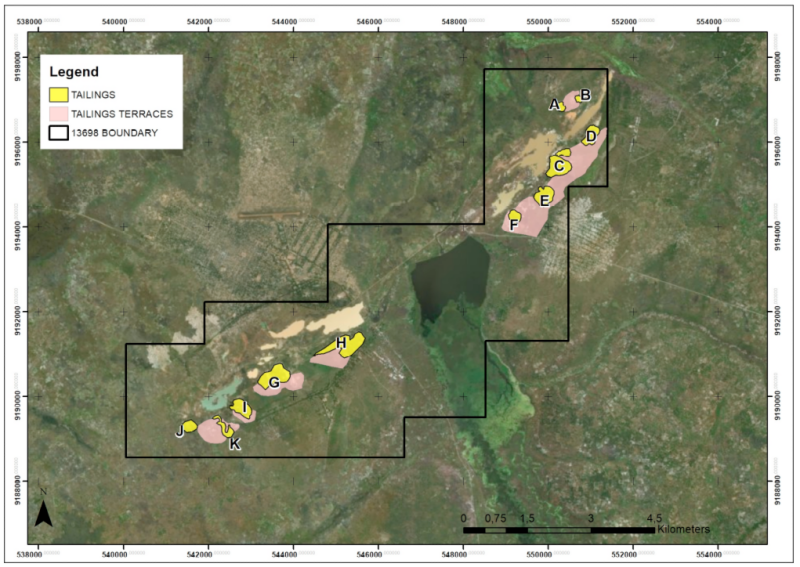
The deposits are named alphabetically, with a suffix used to differentiate between coarse (c) and fine (f) material. The nine tailings that make up the project are from north to south named Cc, Cf, Ec, Hc, Hf, Gc, Gf, Ic and K (see).
The lithium mineralization is primarily hosted in spodumene with minor lepidolite. Tin mineralization is hosted in cassiterite and tantalum in tantalite.
The nine tailings deposits have been evaluated by air core drilling, completed from
Drilling was orientated vertically, with the densest drilling found on the K deposit, where holes were spaced 40 m apart. The Gf and Hf deposits were drilled at a spacing of 80 m. The remaining deposits were drilled on an irregular spacing ranging from 20 m to 80 m. Most of the drilling has intercepted the contact representing the pre-depositional surface. The positions of the tailings deposits relative to one another are shown in.
Figure 3: Manono Lithium Tailings Project Area
Click Image To View Full Size
Mineral Resource
The Mineral Resource was estimated using
Table 1: Manono Mineral Resources at 0.20% Li2O Cut-Off Grade –
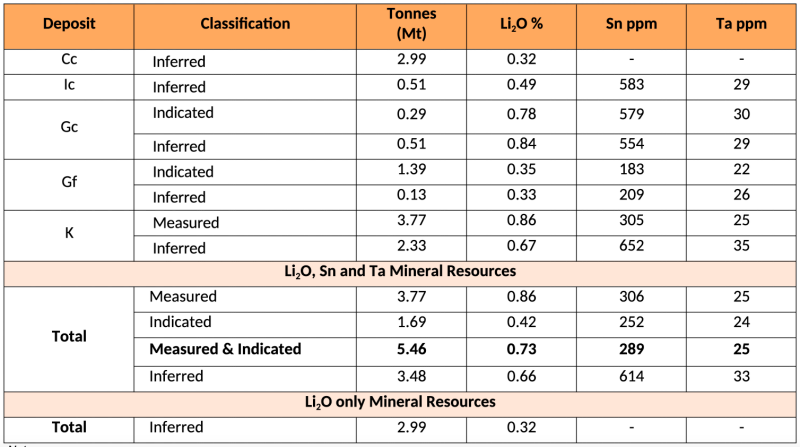
Click Image To View Full Size
Notes:
All tabulated data have been rounded and as a result minor computational errors may occur.
Mineral Resources are not Mineral Reserves, have no demonstrated economic viability.
Li2O % grades calculated by applying a factor of 2.153 to Li % grades.
Mt = Million tonnes, ppm = parts per million
Inferred Li2O, Sn and Ta Mineral Resources are totalled for the Southern Sector dumps (Ic, Gc, Gf and K).
Inferred Li2O only Mineral Resources are for the Cc dump.
Additional drilling is recommended for several deposits in order to improve the confidence in the Mineral Resource estimates.
Mining
The tailings dumps will be reclaimed by an excavator at each of K, I and G dumps and loaded onto dump trucks for transport onto an overland conveyor that will feed a stockpile at the process plant.
A series of three, 900 mm wide belt overland conveyors will transport a total of 240 tonnes per hours to the process plant stockpile approximately 3,300 m from the reclaimed dump blending pad. The first two segments of the conveyors will be enclosed by guarding and be elevated approximately 1.5 m off the ground on concrete pedestals, elevating higher at the location of the two transfer towers. The final, 295 m conveyor section will be elevated on trestles at approximately 6 m heigh and to allow for safe crossing over a major road and population center.
Measured, Indicated and Inferred mineral resources were included in tailings dumps reclaiming schedule as potential mineral inventory, and while the Indicated were primarily targeted to show where additional resource drilling should betargeted, the inclusion of Inferred, and the nature of a PEA has removed the possibility of the declaration of an Ore Reserve.
The tailings dumps reclaiming schedule indicates approximately 55% of the LOM production is in the Measured and Indicated Mineral Resource category and 45% is in the Inferred Mineral Resource category.
The Company has concluded it has reasonable grounds for disclosing a Production Target, given that the PEAonly focused on the mining of a high-grade part of the Mineral Resource Estimate (Dumps I, G and K). So, the PEA only covers 7.58Mt of the estimate at1.26Mt of ROM ore to the mill each year.
The mining rate required to ensure continuous mill feed, and the production targets, is determined by the production schedule, however the rate needs to be cognizant of mining fleet size, equipment productivities and shift arrangements.
Processing
Material from the tailings dumps will be processed into a 5.5wt% Li2O concentrate using a robust process flowsheet consisting of crushing, dense media separation and flotation, dewatering and bagging.
The Manono tailings dumps has two broad ore types that will be presented to the process plant:
• Coarse grained spodumene
•Fine grained spodumene
The process flowsheet is based on a typical hard rock spodumene resource, which is amenable to both Dense Media Separation (DMS) and froth flotation to achieve a target concentrate grade of 5.5% Li2O, and incorporates the current understanding of resources size, grade, mineralogy and crystal grain size, as well as information from Heavy Liquid Separation (HLS) test work undertaken to date.
Stockpiled material in proximity to the processing facility is reclaimed by front end loader onto a belt conveyor that feeds a vibrating screen with a 5 mm deck. Oversize material falls into a double roll crusher and is returned to the belt conveyor. Screen undersize material is transported onto a wet vibrating screen with a 500 µm deck. Wet screen oversize is transferred into the DMS (Dense Media Separation) plant feed tank, while the wet screen undersize falls into a pump box for feeding into the wet grinding and flotation plant.
A two stage DMS plant is used to produce 5.5 wt% Li2O concentrate where the primary DMS floats (tailings) are transported by a series of moveable conveyors to the TSF. Secondary DMS floats (middlings) are pumped to wet grinding and the flotation plant, followed by dewatering by a centrifuge and are then sent to the bagging plant. Secondary DMS sinks are dewatered by a centrifuge and then sent to the bagging plant.
Figure 4 shows a schematic of Manono process flowsheet, which uses conventional processing technologies, however it is a 4thgeneration spodumene concentrator adopting learnings and optimizations from existing spodumene operations to ensure high efficiency through every process unit operation. These optimizations include:
Maximize mineral liberation for effective coarse and fine spodumene recovery
Minimize slimes losses
Effective rejection of gangue minerals including mica and iron silicates
Efficient milling, desliming and float conditioning to maximize fines recovery
Maximize plant availability by employing high wear resistant materials of construction and duty/standby equipment where necessary
Crushing and Screening
The 15,000 tonnes process plant stockpile will be reclaimed by a front-end loader and fed onto a belt conveyor that will transport the material onto the vibrating, crusher sizing screen. The 5mm screen deck will divert oversized material into a double roll crusher, that will return the material onto the crusher feed conveyor. Spray water will be used on this screendeck to push finer material to the undersize. Screen undersize will flow onto a vibrating wet sizing screen with a 500 µm deck. The wet sizing screen will divert the oversize material into the DMS plant feed tank and the undersize into the wet grinding plant feed pump box.
DMS Plant
The wet screen oversize material will be combined with Ferrosilicon (FeSi) media to increase the specific gravity of the slurry to 2.65t/m3before entering the primary DMS cyclones. The primary DMS cyclone overflow (floats) will be dewatered through a screen to 15% moisture and transported by a series of grasshopper conveyors to the Tailings Storage Facility (TSF). Primary cyclone underflow (sinks) will be combined with additional FeSi to increase the specific gravity to 2.85t/m3before entering the secondary DMS cyclones. Overflow from the secondary cyclone (middlings) will be pumped to the wet grinding plant. Secondary cyclones underflow is transferred to a dewatering centrifuge. FeSi media is recovered from primary and secondary DMS cyclones through drain and rinse screens, and magnetic separators.
Wet Grinding
Wet screen undersize and DMS middlings are pumped to a ball mill for wet grinding. The product slurry is pumped to a hydrocyclone with a cut point of 300 µm. Cyclone overflow (-300 µm) is fed to the flotation plant and the underflow (+300 µm) is recycled back to the ball mill.
Flotation Plant
The ball mill cyclone overflow is pumped to a high intensity scrubber followed by a desliming cyclone and a magnetic separator. The iron-deficient slurry is then pumped into two-stages of mica reverse flotation cells. The floated mica is pumped to the tailings thickener with the remaining slurry being pumped into a dewatering cyclone.
The mica-deficient, dewatered slurry passes through a high-density scrubber and a desliming cyclone before being pumped into four-stages of lithium spodumene flotation cells. Tailings from the rougher and scavenger cells are pumped to the tailings thickener while the concentrate is pumped to the cleaner cells. Concentrate from the first cleaner stage is pumped into the second stage cleaner to produce a final product concentrate that is pumped to the dewatering centrifuge. Tailings from the cleaner cells are pumped to the tailings thickener.
Product Dewatering and Bagging
Spodumene concentrate from the DMS and Flotation plants is pumped into dedicated screen bowl centrifuges for final dewatering, targeting 5% moisture. The dewatered concentrate is transferred into dedicated storage bins to feed the product bagging plants. Each concentrate type will have a dedicated bagging plant that will include automatically filling 1 tonne bulk bags, bag labeling, and transporting the filled bags on an accumulating conveyor for forklift handling. The 1 tonne bulk bags will be removed from the accumulating conveyors by forklifts for storage on wooden pallets in a covered area at the process plant. Forklifts will maneuver the palletized bags onto transport trucks that will deliver the bags to a warehouse location in Lubumbashi. From Lubumbashi, the palletized bags will be loaded onto 26 tonne capacity trucks for transport to the port of Dar es Salaam,
Figure 4: Manono spodumene concentrate process flowsheet

Click Image To View Full Size
Tailings Dewatering
A single high-rate thickener will collect various tailings streams generated throughout the process plant. These streams consist of effluent from the DMS plant, fines in the desliming cyclone overflow, overflow from the dewatering cyclones, magnetic separation tailings, mica reserve flotation concentrate and spodumene flotation tailings.
The solids present in the feed streams will settle to the bottom of the thickener and water is recovered through the overflow weir. The recovered water is pumped to the process water pond. The underflow slurry will be pumped to the TSF at 55% moisture.
Reagents
The DMS Plant will use ferrosilicon (FeSi) as the densifying agent. The FeSi will be stored in waterproof steel drums under a roof at the process plant.
The flotation plant will require several reagent types, that will be stored in plastic totes under a roof at the process plant. The reagents will include a frother, amine collectors and sodium-based compounds as regulators. A flocculant will be added to the tailings thickener to assist in solids settling. The flocculant will be stored in plastic totes under a roof at the process plant, near the thickener.
Infrastructure
All associated infrastructure required to support the Manono operation is included in the PEA. Capital provisions were included for the following items: power generation, site roads, accommodation and mess facilities, water supply, wastewater treatment, administration buildings, telecommunications, security, warehouse, maintenance and tailings storage facility, bulk fuel farm, laboratory, and emergency response facilities.
Energy consumption is estimated at 4MW and has been costed using diesel generators. Significant improvement can bemade by incorporating the options for energy supply from
Export route
The export route considered in the PEA for bringing material to site and export of product is the N33 between Manono to Lubumbashi, a distance of approximately 600km.
Estimate has been made with current road conditions which allow 6x6 trucks carrying 20 tons.
An allowance of
Tailings Management
Primary DMS tailings pass a dewatering screen to achieve 13% moisture and are directed to a series of conveyors running from the process plant to dry stacking at the Tailing Storage Facility (TSF). The system consists of mobile grasshopper conveyors which direct the solids to an end section that distribute the solids in an arc via a stacker conveyor.
Tailings from the flotation thickener underflow at 55% moisture are pumped via an above ground pipeline to a spigot system along the western side of the TSF.
The TSF is sized to store a total of 10 million tonnes of tailings, over the six-year plant life. The TSF is located southeast of the process plant, sloping eastward at an average grade of 3.8%. The natural slope will ensure that the final tailings pile does not exceed a height of 24 m. The entire 494,000 m2area will be lined with EPDM.
Environmental Studies, Permitting and Social or Community Impact
Collection of baseline data for the Manono Lithium tailings project has been ongoing since
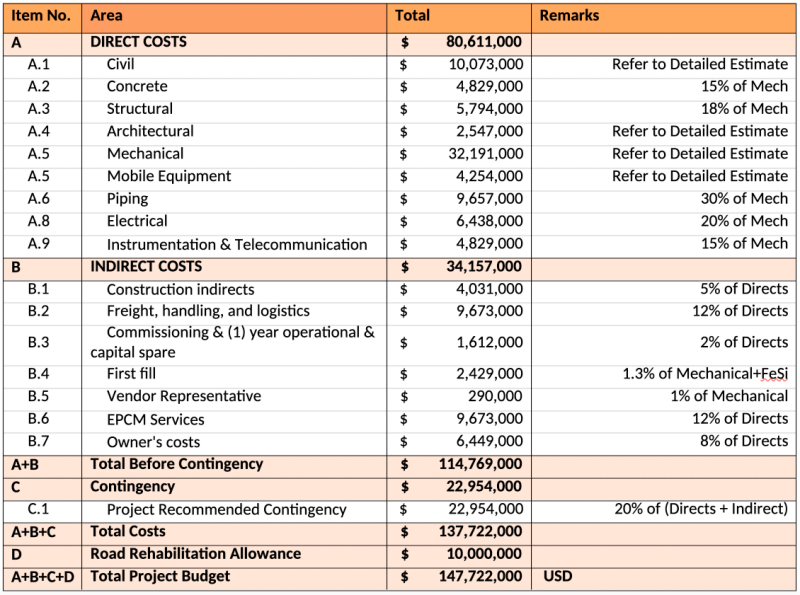
Capital Expenditures
The estimate meets the minimum requirements of a Class V estimate as defined in AACE International Recommended Practice No. 18R-97. The CAPEX estimate has an intended accuracy of ±35%. The total Direct CAPEX to bring the Project to operation is estimated to be
The capital estimate has been developed using preliminary MTOs and unit pricing obtained from either contractor or vendor supplied quotations. Approximately 70% of total equipment supply value for the
Contingency is intended to cover items that are included in the scope of work as described in this report but cannot be accurately defined due to the normal range of variability of quantities, productivity, unit rates, the current level of Engineering and other factors that affect the accuracy of the expected final cost of the Project. The total for Contingency calculated 20% of the total (direct + indirect) costs.
Table 3 below presents the Project CAPEX Summary.
Table 1: Project CAPEX Summary
Click Image To View Full Size
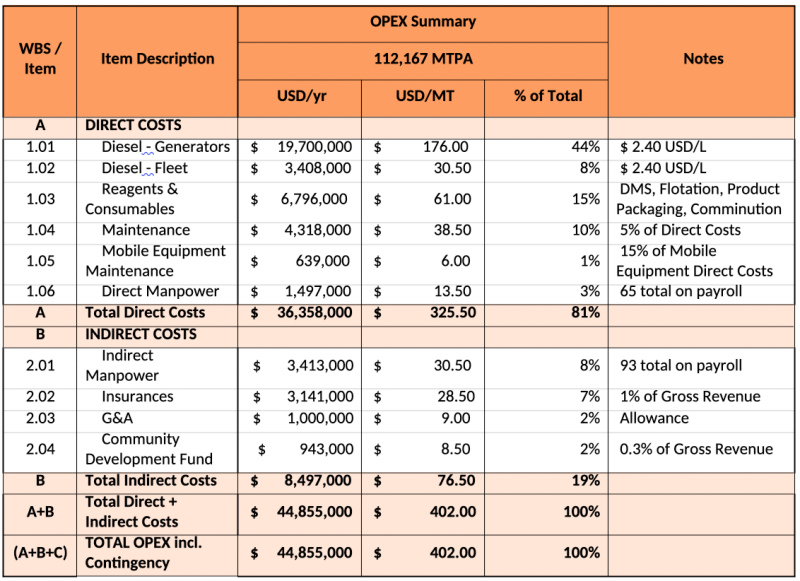
Operational Expenditures(OPEX)
The estimate meets the minimum requirements of a Class V estimate as defined in AACE International Recommended Practice No. 18R-97. The OPEX estimate has an intended accuracy of ±35%. The total estimated OPEX is
The project OPEX was based on Process Flow Diagrams and Mass Balances, Load Lists and Layouts. Other supporting data includes vendor pricing and specifications, and historical data from previous projects. The full-rate operating hours for the process plant used in the OPEX estimate was 7,600 hours per year. Annual spodumene production was 112,167 tonnes per year on a dry basis and 118,071 tonnes per year on a wet basis. No contingency has been considered for the OPEX for the project.
The OPEX summary excludes the following which are only captured in the cash flow.
a)
Product Transport ; (Included only in cash flow);b)Marketing; (Included only in cash flow);
c)Royalties; (Included only in cash flow);
Table 4presents a summary of the Annual Operational Expenditures (OPEX) for the Project.
Table 4: Project OPEX Summary
Click Image To View Full Size
The product transport cost is based on a quote received from a local transport agency (
Table 5: Product Transport Cost Basis

Click Image To View Full Size
Financial Analysis
An engineering economic model was prepared for the Project to estimate annual cash flows and assess sensitivities to certain economic parameters. The Project shows a pre-tax cumulative net revenue of
The cash flow estimate includes only revenue, CAPEX, and OPEX costs. Product transport, marketing and royalties were all included as additional costs within the cash flow model. Corporate obligations, financing costs, and taxes at the corporate level are excluded.
The implementation schedule currently estimates the construction timeline to be from
Key metrics are shown below inTable 6for the Manono PEA assumes a weighted average lithium concentrate price of
Table 6: Key Project Financial Metrics
Click Image To View Full Size
A sensitivity analysis was completed to determine the impact of various factors on the project economics (seeFigure 5). Lithium price has the largest influence on theProject financials. For every 10% increase in the lithium concentrate price, the projectNPV10% increased by
Figure 5: Sensitivity Diagram showing the impact of various sensitivities to the Project economics.
Click Image To View Full Size
The PEA has demonstrated that the
Metallurgical testwork is planned in the course of the FS. This work will include grinding, DMS, Flotation and Dewatering tests, which will increase the definition of the process flowsheet. This workstream will allow flowsheet optimisation and vendor testing of preferred equipment for the process plant.
Environmental approvals and permitting for the Project are on the critical path.
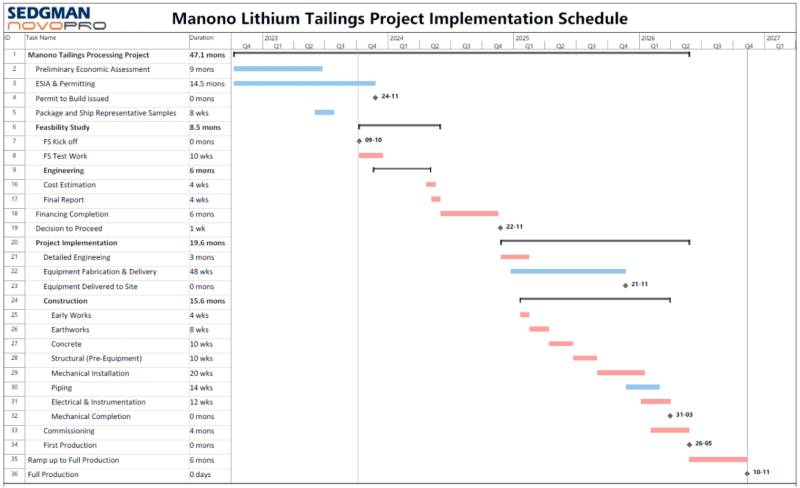
A high-level project schedule is provided inFigure 6.
Figure 6: High-level Project Schedule
Click Image To View Full Size
Filing of Report
The NI43-101 compliant technical report (“Report”) will be filed on SEDAR within the next 45 days.
The Qualified Person for the Mineral Resource estimate is Mr.
Neither
The qualified person for the above ground infrastructure and support systems is Mr.
The qualified person for the mineral processing is Mr.
Neither
Qualified person
Mr.
Mr.
Mr.
About
Tantalex Lithium is an exploration and development stage mining company engaged in the acquisition, exploration, development and distribution of lithium, tin, tantalum and other high-tech mineral properties in
Cautionary Note Regarding Forward Looking Statements
The information in this news release includes certain information and statements about management's view of future events, expectations, plans and prospects that constitute forward looking statements. These statements are based upon assumptions that are subject to significant risks and uncertainties. Because of these risks and uncertainties and as a result of a variety of factors, the actual results, expectations, achievements or performance may differ materially from those anticipated and indicated by these forward looking statements. Although
The Canadian Securities Exchange (CSE) has not reviewed this news release and does not accept responsibility for its adequacy or accuracy.
For more information, please contact:
President & CEO
Email: ea@tantalex.ca
Website: www.tantalexlithium.com
Tel: 1-581-996-3007
Copyright (c) 2023 TheNewswire - All rights reserved.
Copyright (c) 2023 TheNewswire - All rights reserved., source
